FIGURE 5.
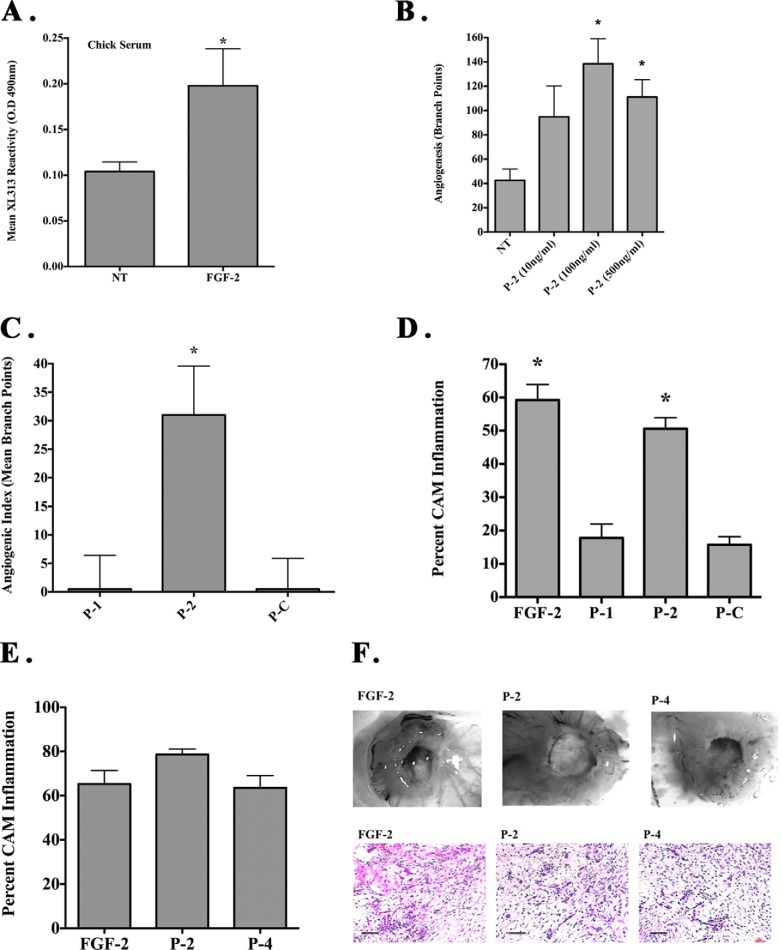
Induction of angiogenesis and inflammation in vivo by soluble RGDKGE but not a related RGDAPG-containing collagen epitope. A, serum from chick embryos in which the CAMs had been either not stimulated (NT) or stimulated with FGF-2 was collected. Relative levels of circulating mAb XL313-reactive epitope were quantified by solid phase ELISA. Data bars represent mean mAb XL313 reactivity ± S.E. (n = 12–13). B, quantification of dose-dependent induction of angiogenesis by RGDKGE-containing collagen peptide P-2. Data bars indicate mean number of branch points ± S.E. from 8 to 12 animal per condition. C, quantification of CAM angiogenesis associated with RGD-containing collagen peptides P-1 (KGDRGDAPG), P-2 (QGPRGDKGE), or control peptide P-C (QGPSGSPGE). Data bars indicate mean angiogenic index derived by subtracting the number of branch points from non-stimulated CAMs ± S.E. from 8 to 12 animals per condition. D, quantification of CAM inflammation associated with FGF-2, RGD-containing collagen peptides P-1 (KGDRGDAPG), P-2 (QGPRGDKGE), or control peptide P-C (QGPSGSPGE). E, quantification of CAM inflammation associated with FGF-2, RGD-containing collagen peptides P-2 (QGPRGDKGE), or P-4 (QGIRGDKGE). All experiments were conducted at least three times with similar results. *, p < 0.05. F, representative examples of inflammatory CAM thickening (×40) (top panel), or Giemsa-positive inflammatory infiltrates (×200) (bottom panel) from CAM inflammation associated with FGF-2, peptides P-2 (QGPRGDKGE), or P-4 (QGIRGDKGE). Scale bars, 50 μm.

