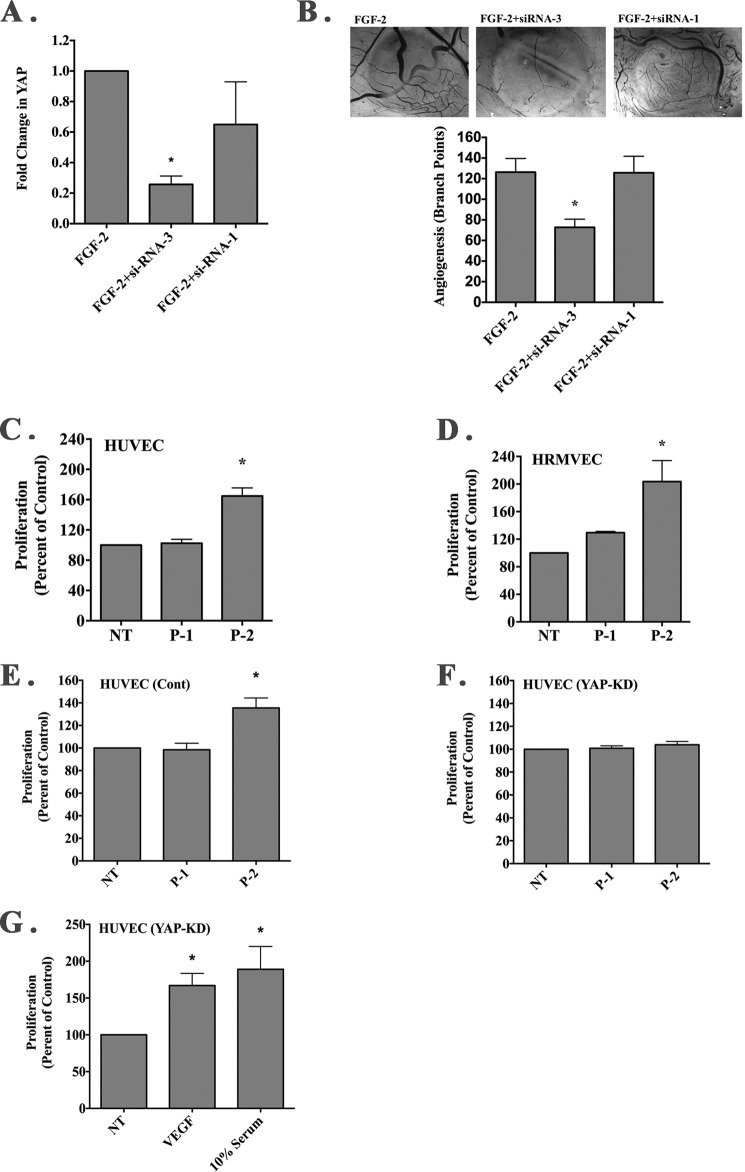
FIGURE 9.
YAP contributes to P-2-stimulated endothelial cell growth. A, siRNAs directed to avian YAP were screened for their ability to knock down expression of YAP following in vivo transfection within FGF-2-induced CAM tissues by quantitative PCR. Data bars represent mean fold change in relative YAP levels ± S.E. from each condition. *, p < 0.05. B, representative examples of angiogenic CAM tissues from each condition (top panel). Photos were taken at a magnification of ×40. Quantification of the number of branching blood vessels from each condition (bottom panel). Data bars represent mean blood vessel branch point counts ± S.E. from 6 to 8 CAMs per conditions. *, p < 0.05. C and D, quantification of HUVEC (C) and HRMVEC (D) growth in the presence or absence of exogenously added RGD containing peptides P-1 or P-2. Data bars represent mean endothelial cell growth (±S.E.) from 3 to 4 independent experiments expressed as percent of control. E and F, quantification of endothelial cell growth in the presence or absence of exogenously added RGD-containing peptides P-1 or P-2 of cells transduced with nonspecific shRNA (E) or YAP-specific shRNA (F). Data bars represent mean endothelial cell growth (±S.E.) from four independent experiments. G, quantification of endothelial cell growth in the presence or absence of exogenously added VEGF (50 ng/ml) or 10% serum from cells transduced with YAP-specific shRNA. Data bars represent mean endothelial cell growth (±S.E.) from four independent experiments. *, p < 0.05.

