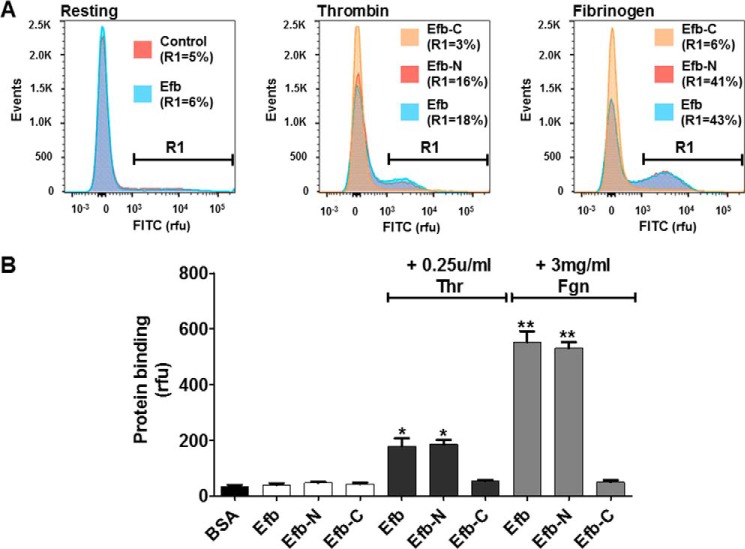
FIGURE 3.
Interaction of the N-terminal region of Efb with platelets. FITC-labeled Efb, Efb-N, Efb-C or BSA (negative control) was incubated at 1 μm concentration with human platelets (107 ml−1). Where indicated, the incubation was performed in the presence of 0.25 unit/ml thrombin (Thr) or 3 mg/ml FGN. Protein binding was assessed by flow cytometry using a FACSAria III. A, representative FITC-labeling histograms. R1 is the subpopulation of platelets with FITC labeling >1000 rfu. B, average FITC labeling for different conditions is reported with S.E. Statistical significance was tested by one-way ANOVA with Bonferroni post test (* = p < 0.01 compared with BSA, ** = p < 0.01 compared with thrombin only for the same protein construct, n = 3).

