FIGURE 4.
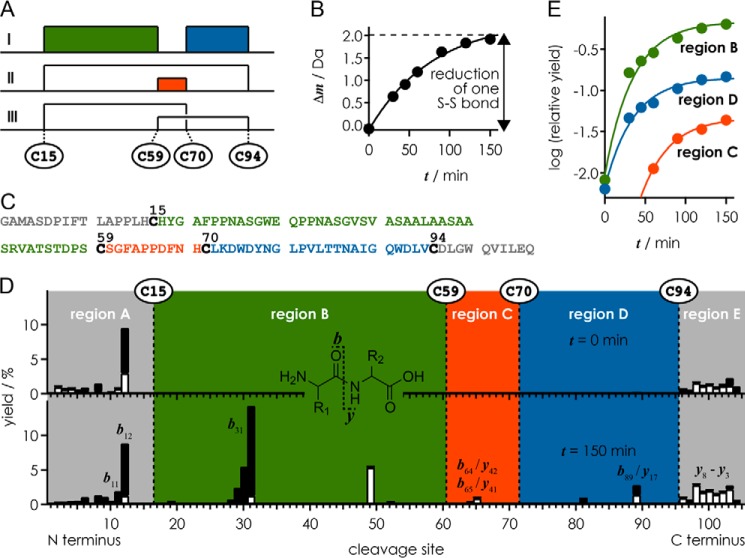
A, possible disulfide bond patterns between Cys-15, Cys-59, Cys-70, and Cys-94. B, increase in average protein mass versus reduction time t. C, amino acid sequence (106 residues) of hLCN2-R-NTD after removal of the N-terminal His6 tag and the TEV cleavage site. D, yield of b (black bars) and y (white bars) fragments from backbone amide bond cleavage (see inset) versus cleavage site at reduction times 0 and 150 min. E, relative yield of the most abundant fragments from cleavage in regions B, C, and D versus reduction time.

