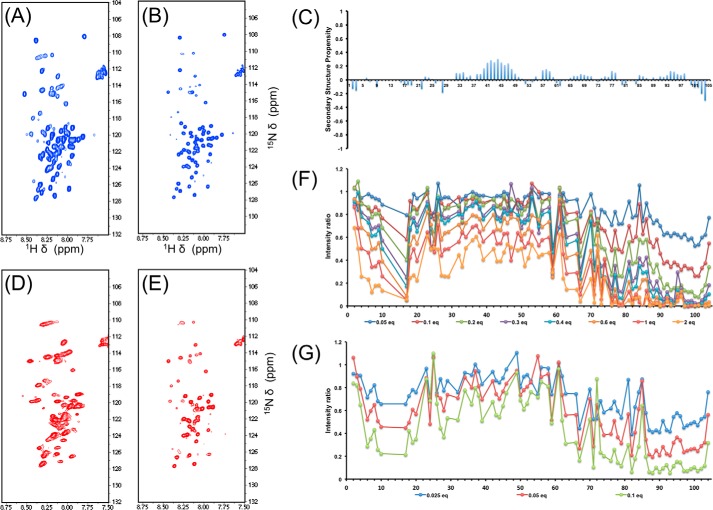
FIGURE 6.
A, 1H,15N HSQC of hLCN2-R-NTD. B, 1H,15N HSQC of hLCN2-R-NTD-QM. C, secondary structure propensity of NGAL-R-NTD-QM. D, 1H,15N HSQC of hLCN2-R-NTD in the presence of saturating concentration of NGAL. E, 1H,15N HSQC of hLCN2-R-NTD-QM in the presence of saturating concentration of NGAL. F, intensity ratio of hLCN2-R-NTD 1H,15N HSQC resonances in the presence of increasing NGAL concentrations. G, intensity ration of hLCN2-R-NTD 1H,15N HSQC resonances in the presence of increasing MTSL-tagged NGAL concentrations.

