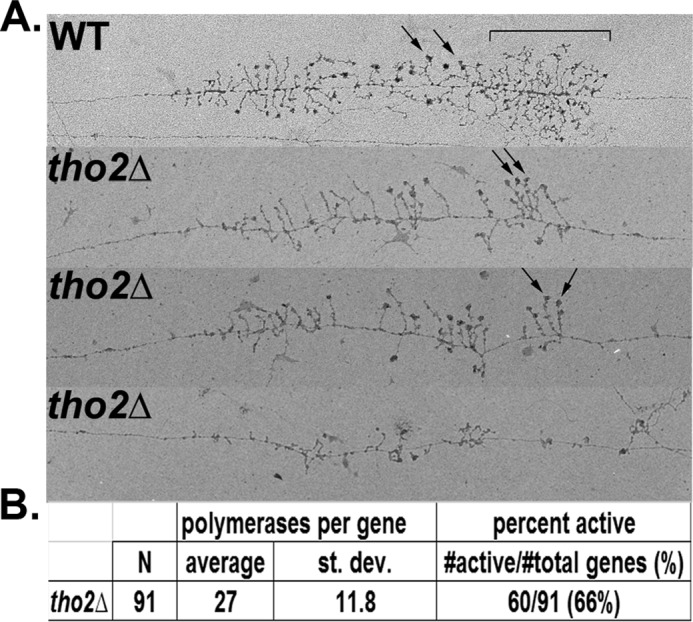
FIGURE 6.

EM analysis of Miller chromatin spread indicates defects in Pol I transcription and rRNA processing in tho2Δ cells. A, representative rRNA genes from Miller spreads of WT (NOY396) and tho2Δ (DAS975). Small subunit processome is indicated by arrows. Cleaved nascent transcripts are indicated by a bracket. B, quantification of Pol I densities and percentage of active rDNA repeats in tho2Δ cells.
