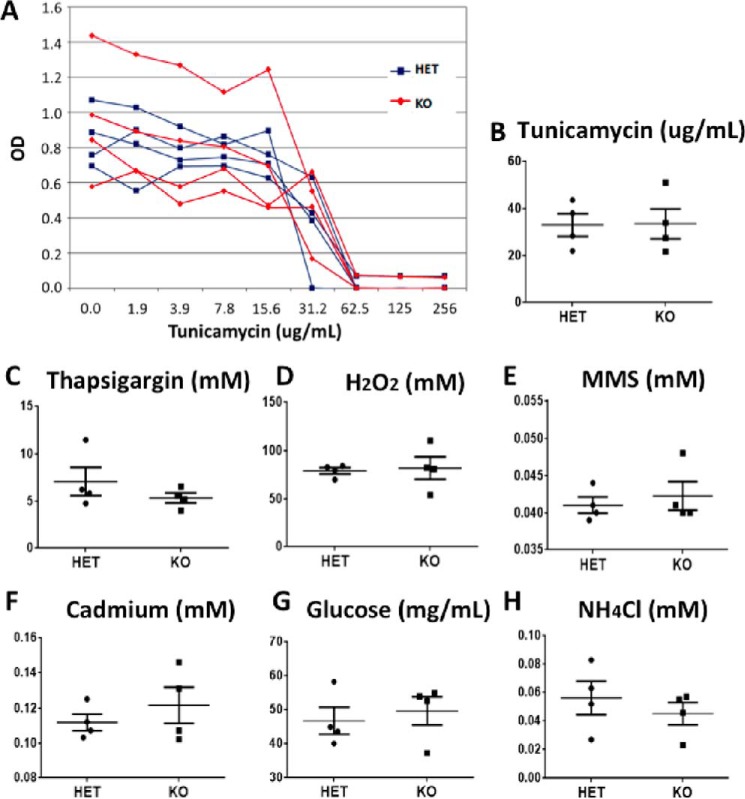
FIGURE 9.
Ube2w KO skin-derived fibroblasts show no difference in response to various cell stressors. A, representative cell survival at various tunicamycin concentrations; the figure shows results for fibroblasts from four individual Ube2w KO and HET mice. B, compilation of LD50 results from experiments as in A; each symbol represents a different donor mouse. C–H, compilation of LD50 results for treatment with thapsigargin (C), H2O2 (D), methyl methanesulfonate (MMS) (E), cadmium (F), glucose deprivation (G), and NH4Cl (H). All graphs show means ± S.E. (n = 4). *, p < 0.05. All graphs show mean ± S.E. indicated by the error bars (n = 4).

