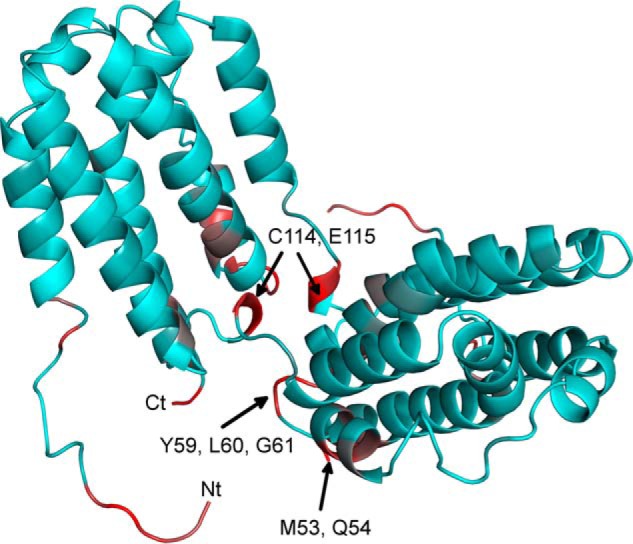
FIGURE 4.

Observed NH chemical shift changes mapped onto the backbone structure of IL-10. The protein structure is shown as a schematic diagram. Residues are colored according to their NH Δδ value relative to that of Leu-60 (with the highest Δδ). Colors correspond to 0% (cyan) and 100% (red) Δδ relative to Leu-60. A possible conformation of the N-terminal region 5–17, which was not resolved in the crystal structure, was appended to the structural model here for visualization of their chemical shift changes.
