
FIGURE 5.
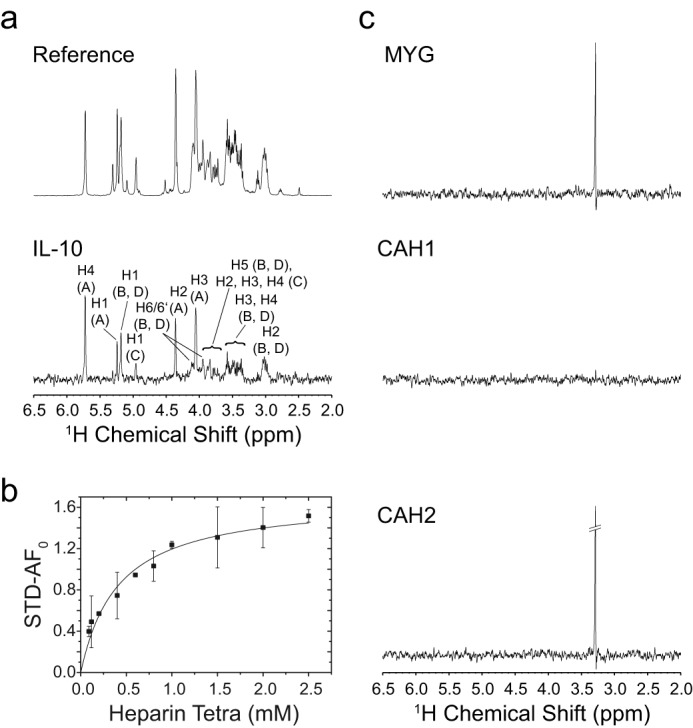
STD NMR measurement of IL-10-heparin binding. a, 600-MHz 1H reference and STD NMR spectrum (×15 magnification) of 3.0 mm heparin tetrasaccharide in the presence of IL-10 in 10 mm sodium phosphate (pD 7.4), 150 mm NaCl, 99.9% D2O at 20 °C. Spectra were obtained with 32 scans at a protein/ligand ratio of 1:75 and a saturation time of 5.0 s. STD signals are assigned to their respective heparin ring protons. The chemical structure of heparin with designation of the sugar rings is shown in Fig. 6. b, binding curve of heparin tetrasaccharide as obtained from the initial growth rates of the STD amplification factor (STD-AF). The STD signal of proton H4 of ring A at the non-reducing sugar end was analyzed. Error bars for each titration point were obtained from the fit of the STD buildup curve to an exponential function. The binding curve was obtained by fitting the initial growth rates (STD-AF0) to a one-site binding model. c, STD control experiments with non-heparin-binding proteins: equine myoglobin (MYG), human carbonic anhydrase 1 (CAH1), and bovine carbonic anhydrase 2 (CAH2). The same experimental conditions as for IL-10 were employed. All STD spectra are shown with ×15 magnification. For myoglobin and bovine carbonic anhydrase 2, an STD signal at around 3.25 ppm was detected, which very likely represents an additive of glycine in the commercially sold protein preparations.