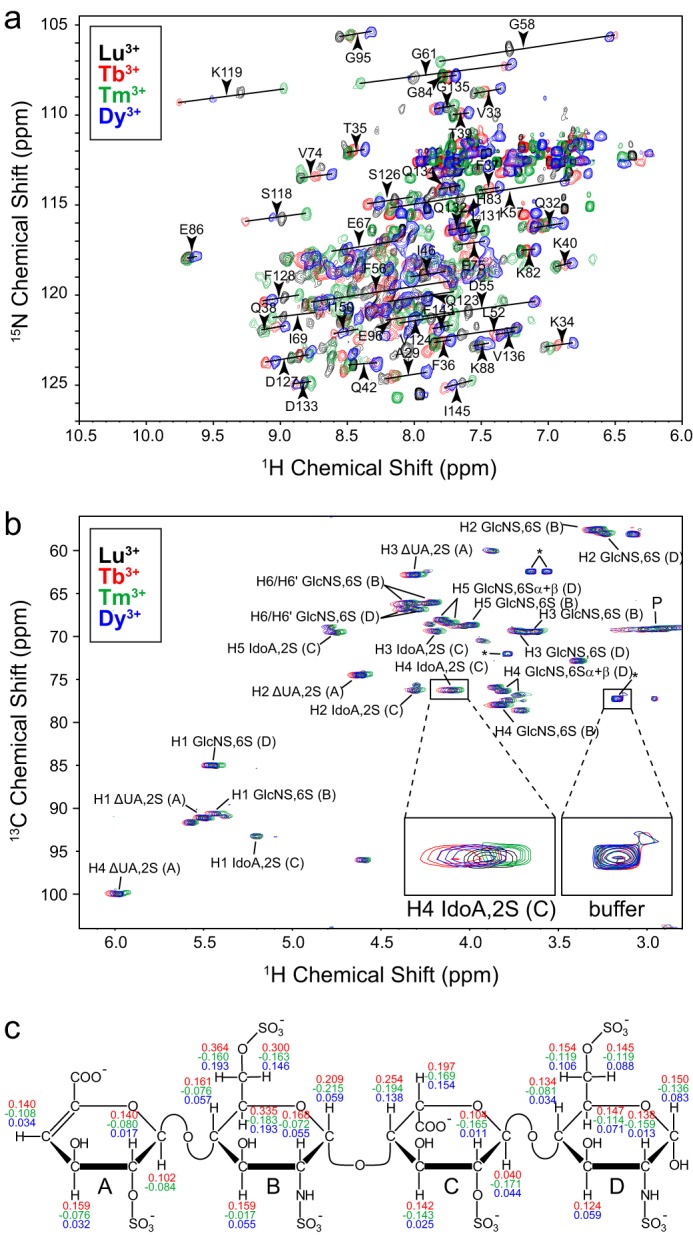
FIGURE 6.

PCS measurement of IL-10 and its heparin ligand. a, 1H-15N HSQC spectra of mixed IL-10-LBT in the presence of 1 eq of Lu3+ (black), Tb3+ (red), Tm3+ (green), and Dy3+ (blue), respectively, at 600 MHz and 30 °C. PCS vectors of selected amino acid residues are indicated as black lines between corresponding diamagnetic and paramagnetic peaks. b, 1H-13C HSQC spectra of heparin tetrasaccharide in the presence of uniform IL-10-LBT complexed with Lu3+ (black), Tb3+ (red), Tm3+ (green), and Dy3+ (blue), respectively. The protein/ligand ratio was 1:4. The assignment of the heparin CH groups is shown. Sugar rings are labeled with capital letters beginning at the non-reducing end. Signals arising from residual not 2H-labeled HEPES buffer and from the protein are marked with asterisks and P, respectively. Buffer signals can serve as internal references, which show no shift compared with heparin signals. c, chemical structure of heparin tetrasaccharide with measured PCS values. The same color coding as in a and b is used.
