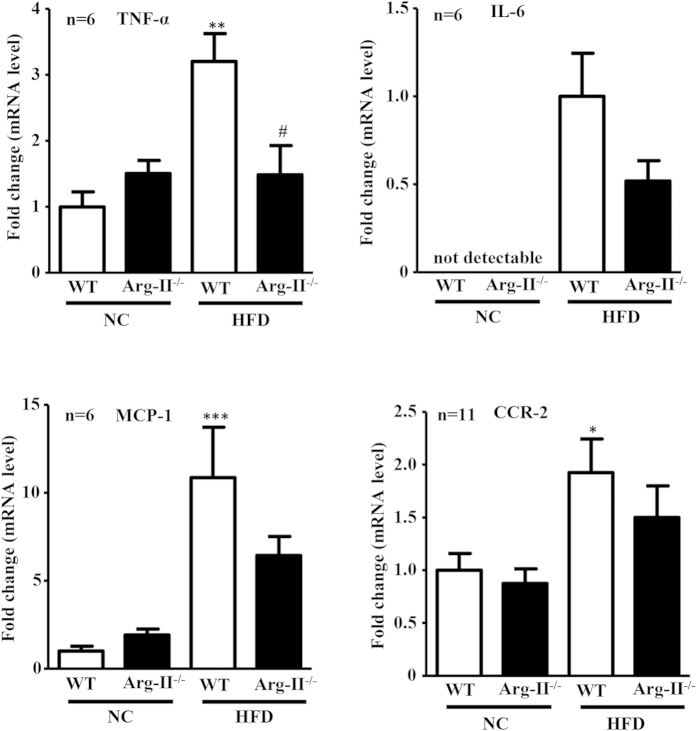
Figure 6. Decreased cytokine production in liver of Arg-II−/− mice.
qRT-PCR analysis of mRNA expression of cytokines in liver tissue from WT and Arg-II−/− mice either on NC or HFD. Except for IL-6, all data are presented as fold change from WT-NC group, since IL-6 is not detectable in WT-NC; the data for IL-6 are presented as fold change from WT-HFD group. *p < 0.05, **p < 0.01, ***p < 0.001 vs WT-NC group; #p < 0.05 vs WT-HFD group.

