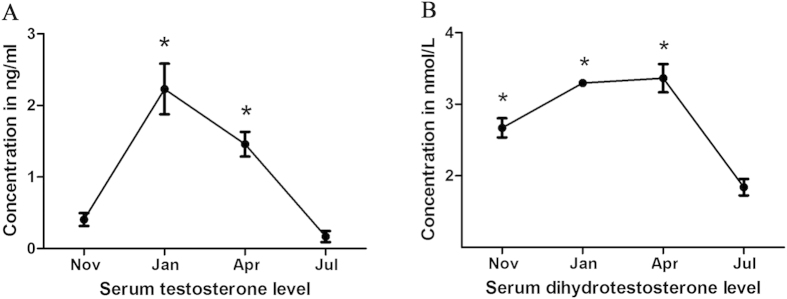
Figure 3. Circulating testosterone (A) and dihydrotestosterone (B) concentrations during the hibernation (from November to the next April) and non-hibernation (July) seasons.
For testosterone, the values (*) obtained in January and April were significantly different (P < 0.05) from those obtained in July. For dihydrotestosterone, the values (*) obtained in November, January and April were significantly different (P < 0.05) from those obtained in July.

