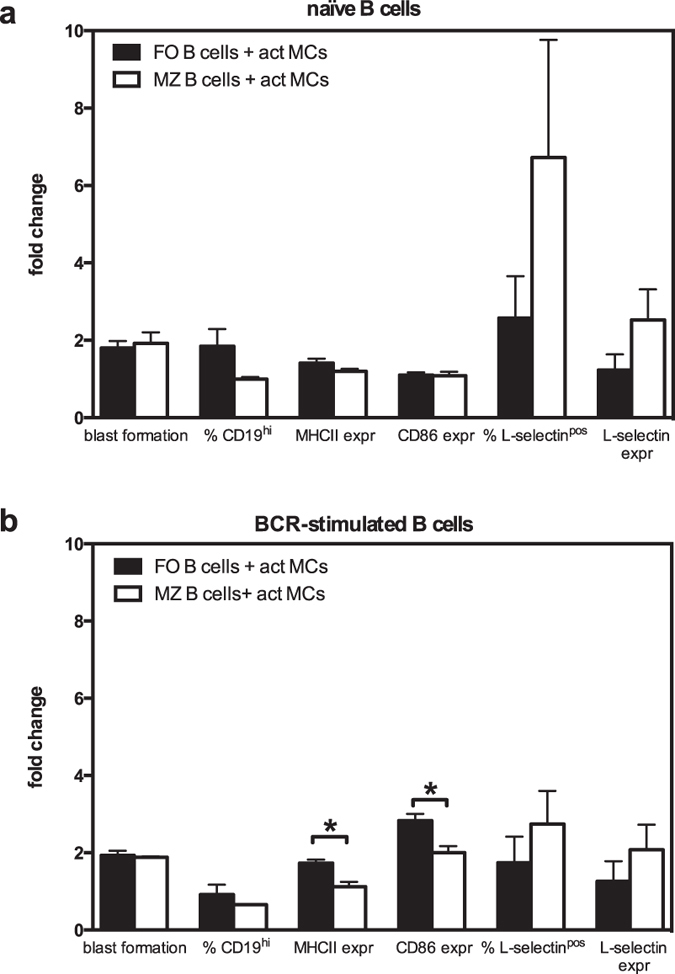
Figure 5. MCs influence different B-cell subsets.

Splenic B cells were separated into marginal zone (MZ) and follicular (FO) B cells by FACS and were cultured alone or together with antigen-activated MCs (act MCs). The B cells were either naïve (a) or BCR-stimulated (b). The cultures were analysed by flow cytometry where blast formation was determined as % B cells large in FSC, the upregulation of CD19 was expressed as % CD19hi of total B cells, and B-cell expression of MHCII and CD86 as median fluorescence intensity. The percentage of B cells positive for L-selectin (% L-selectinpos) and the L-selectin expression (median fluorescence intensity) was also determined. Results are expressed as mean fold change (as compared to naïve or BCR-stimulated B cell subset cultured alone) + SEM (n = 3). *p < 0.05. BCR, B-cell receptor; FSC, forward scatter; MHCII, class II MHC.
