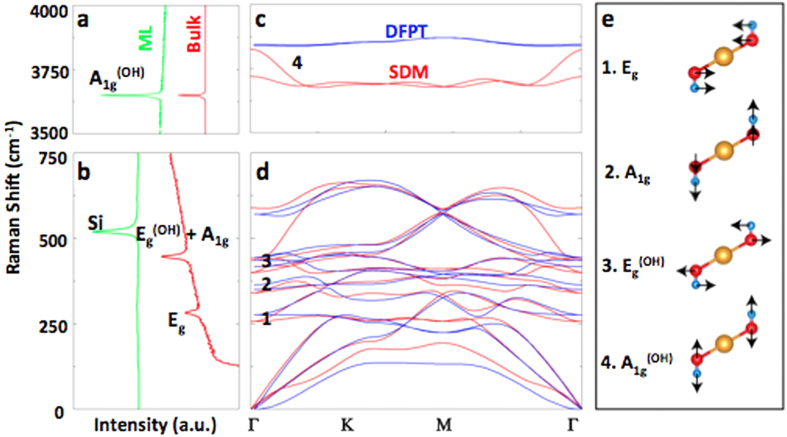
Figure 2.
Phonon dispersion and Raman spectrum of Mg(OH)2. Raman spectroscopy measurements taken from thick flakes and monolayers of Mg(OH)2 in the (a) high frequency (3500–4000 cm−1) and (b) low frequency (0–750 cm−1) range. (c-d) Phonon dispersion calculated by density functional perturbation theory (DFPT) in blue and small displacement method (SDM) in red for high and low frequencies, respectively. (e) Corresponding optical modes highlighted in Fig. 2a,b.

