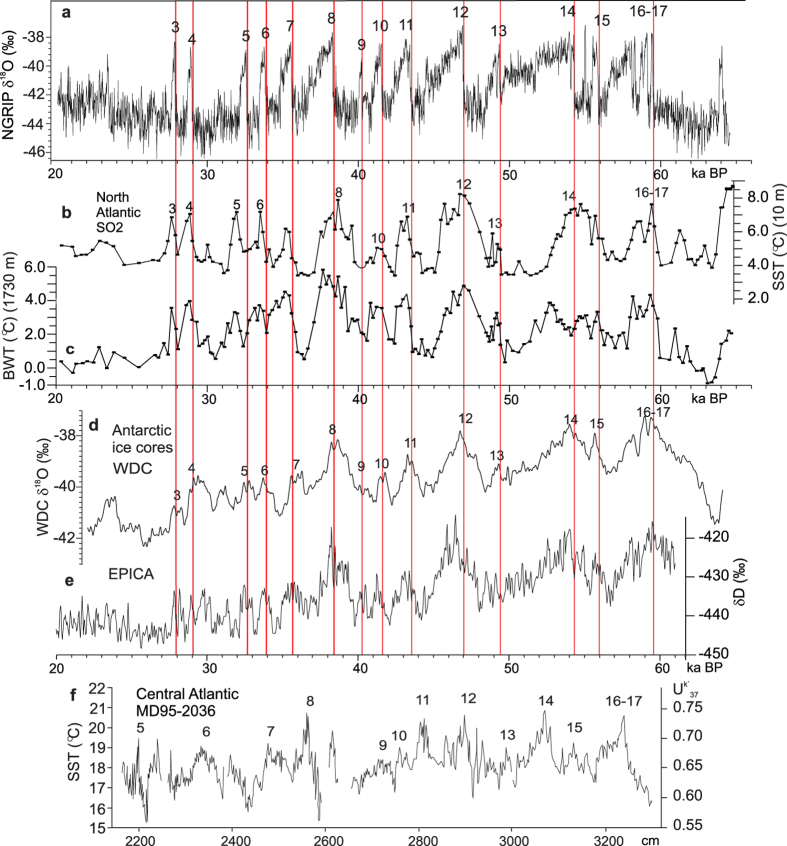
Figure 5. Glacial SST variability for core SO82-02GGC compared to Arctic and Antarctic climate proxies and SST for marine core MD95-2036.
(a) δ18O record from Greenland NGRIP ice core on GICC05 time scale37. (b) Sea surface temperatures at 10 m water depth for marine core SO82-02GGC plotted versus calendar age. (c) Bottom water temperatures at 1730 m water depth for marine core SO82-02GGC plotted versus calendar age. (d) δ18O record for Antarctic ice core WDC calculated to AICC12 time scale (~=NGRIP GICC05 time scale)16. (e) δD record for Antarctic ice core EPICA plotted versus GICC05 time scale14. (f) Alkenone sea surface temperature from marine core MD95-203618 plotted versus core depth (cm). For location of core MD95-2036 see Fig. 1, no. 22). Red lines indicate position of stadial/interstadial boundaries.

