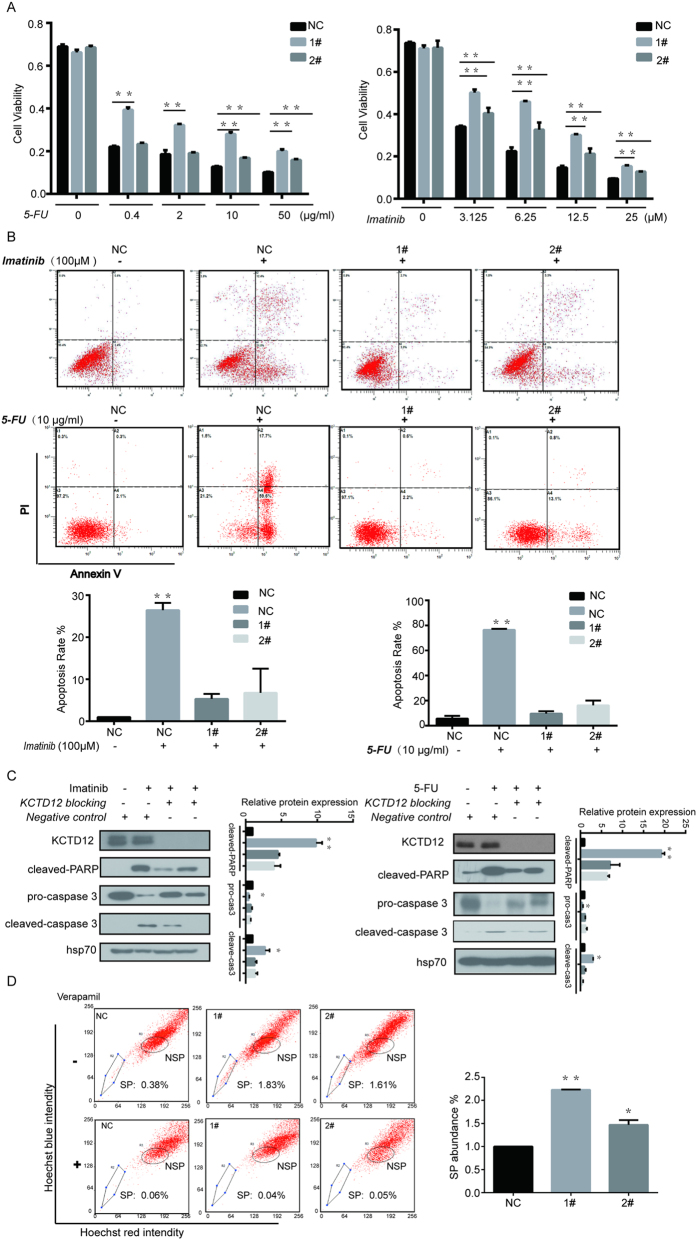
Figure 5. Silencing of KCTD12 enhances the drug resistance to both imatinib and 5-FU in HT29 cells.
(A) HT29 cells with silenced KCTD12 were seeded in 96-well plates at a density of 5 × 10³ per well and treated with increasing concentrations of imatinib and 5-FU, as indicated. Cell viabilities were detected by the MTT assay. (B) HT29 cells with silenced KCTD12 were seeded in 6-well plates at a density of 5 × 10⁵ per well and treated with 100 μM imatinib for 24 h or 10 μg/ml 5-FU for 48 h, as indicated. The apoptosis rates were detected with the Annexin ν/PI kit and analyzed by flow cytometry. (C) Western blotting analysis of cleaved-PARP, procaspase3 and cleaved caspase 3. The experiments were repeated three times. (D) The side population (SP) cells assay. HT29 cells with silenced KCTD12 were treated with 50 μg/ml verapamil and 0.1 μg/ml Hoechst 33342 dye and subjected to flow cytometric analysis. Representative flow cytometric histograms demonstrating a distinct SP cells fractions. The quantified results were presented as the means ± SD (n = 3). *P < 0.05, **P < 0.01.

