
Figure 1. Overall structure of the glucosidase II α subunit.
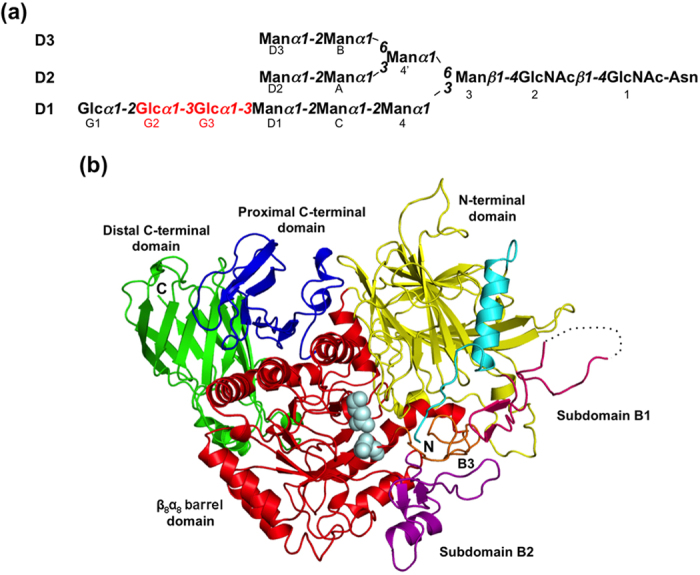
(a) Schematic representation of Glc3Man9GlcNAc2 showing the nomenclature of oligosaccharide residues and branches. Glucose residues trimmed by GII are shown in red. (b) Ribbon model of GIIα is represented with positions of N and C termini and individual domains. The individual domains are colored as the following: N-terminal domain (yellow), subdomain B1 (hot pink), β8α8 barrel domain (red), subdomain B2 (purple), subdomain B3 (orange), proximal C-terminal domain (blue), and distal C-terminal domain (green). The characteristic N-terminal segment is colored in cyan. The catalytic residues are shown as pale cyan sphere models.