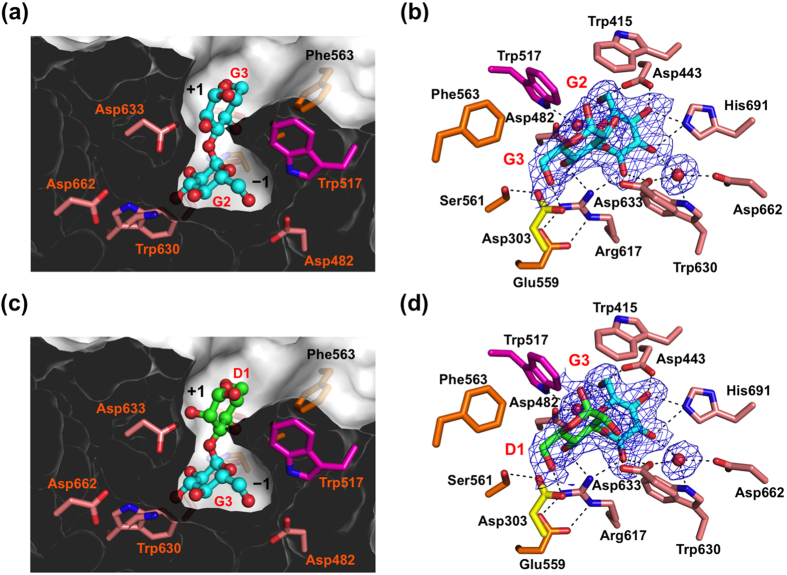
Figure 2. Substrate-binding site of GIIα.
Substrate-binding pocket represented by sliced surface models and detailed substrate–interaction network with potential hydrogen bonds of GIIα are indicated: (a,b) Glc-α1,3-Glc-bound form, (c,d) Glc-α1,3-Man-bound form. Omit Fo-Fc electron density map of Glc-α1,3-Glc (b), Glc-α1,3-Man (d), and bound water molecules contoured at 2.0 σ. Bound sugar ligands and residues involved in ligand binding are shown in stick models. Water molecules are shown in sphere models. Dashed lines indicate potential hydrogen bonds.

