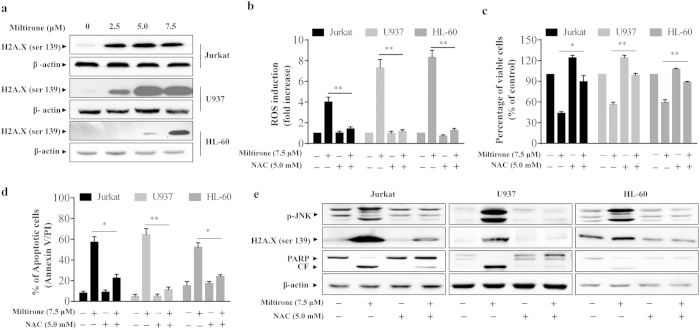
Figure 4. Role of ROS generation in miltirone induced apoptosis.
(a) Jurkat, U937 and HL-60 cells were incubated with miltirone (0–7.5 μM) for 12 h, and the expression of H2A.X (ser 139) and β-actin was analyzed by western blotting; n = 3. The bands were excised from different gels which were run under the same electrophoresis condition. (b) Cells were treated with 7.5 μM miltirone for 1 h in the presence or absence of 5 mM NAC and the level of intracellular ROS was measured by flow cytometry. (c–e) Cells were treated with 7.5 μM miltirone for 12 h in the presence or absence of 5 mM NAC, cell viability (c), apoptosis (d) and the expression of p-JNK, H2A.X (ser 139), PARP, cleaved fragment (CF) of PARP and β-actin (e) were analyzed; n = 3. The bands were excised from different gels which were run under the same electrophoresis condition. Data were presented as Mean ± SD. The differences were significant at *p < 0.05, **p < 0.01 miltirone vs. co-treatment with miltirone and NAC.

