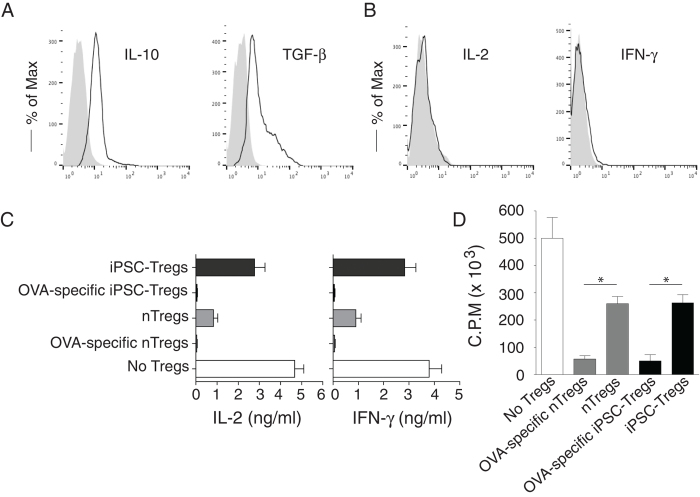
Figure 2. Functional analyses of Ag-specific iPSC-Tregs.
On day 28 of in vitro co-culture, the SP CD4+TCRβ5+ iPSC-Tregs were sorted and stimulated by T-depleted splenocytes (APCs; Tregs/APCs = 1:4) pulsed with OVA323-339 peptide (A,B), or mixed with naive CD4+ T cells (CD4+ CD25-) from OT-II TCR Tg mice (Tregs/T cells = 1:10) and then stimulated by the APCs pulsed with OVA323-339 peptide for 2 days (C,D). The proliferation and cytokine production were assessed. For suppressive assays (C,D), a group of CD4+ T cells stimulated with OVA-specific nTregs (CD4+ CD25+) from OT-II TCR Tg mice and a group of CD4+ T cells stimulated with non-specific nTregs (CD4+ CD25+) from C57BL/6 mice as positive controls, and a group of CD4+ T cells stimulated without Tregs as the negative control. Intracellular cytokine production (IL-10, IL-2, and IFN-γ) or surface LAP (TGF-β) was analyzed by flow cytometry after gating on live CD4+ CD25+ cells (dark lines; shaded areas indicate isotype controls) or by ELISA, and proliferation was determined by [3H] thymidine incorporation. (A) Intracellular IL-10 and surface TGF-β. (B) Intracellular IL-2 and IFN-γ. (C) IL-2 and IFN-γ production were measured by ELISA at 40 h. Data are representative of three experiments. (D) Thymidine incorporation during the last 12 hrs. Data are representative of three experiments. *P < 0.05, one-way ANOVA tests.

