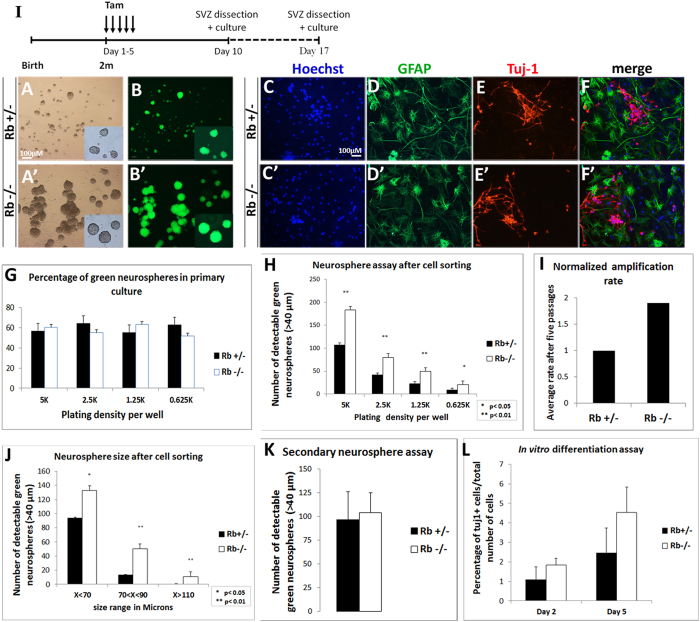
Figure 6. Rb controls adult aNSCs/progenitors proliferation in vitro without affecting their differentiation potential.
(I) Experimental design for the neurosphere assays performed in vitro: 5 d and 12 d after deletion of Rb, SVZ tissues from Rb+/− and Rb−/− animals were dissected and cultured. (A–A′) Bright-field and (B,B′) fluorescent images showing the increase in the number and size of green fluorescent neurospheres generated from sorted NSCs/progenitors derived from Rb+/− vs Rb−/− cultures (n = 5Ct and 5Mut). (C–F′) Double labeling with anti-GFAP and anti-Tuj1 revealed that Rb-null progenitors differentiate into astrocytes (D,D′) and neurons (E,E′) similar to Rb+/− cells (n = 3Ct and 3Mut). (G) Neurosphere quantification showed that 55–60% of neurospheres generated in primary cultures are green fluorescent in Rb+/− and Rb−/− mice. (H) Graph showing the average number of green fluorescent neurospheres detected in five decreasing cell densities at 7 d in Rb−/− versus Rb+/− cultures, respectively. (I) Graph showing a 1.9 fold increase in the average amplification rate (normalized) in Rb−/− vs Rb+/− cultures after 5 passages. (J) Graph depicting the average size of Rb-null neurospheres detected in culture compared with controls after 7 d. The higher number of detectable spheres in the absence of Rb is due to a higher amplification rate (I) and reflects enhanced proliferation. (K) Secondary neurosphere assays were performed by dissociating single neurospheres of equal size from Rb+/− vs Rb−/− cultures and showed similar results between genotypes. (L) Rb-null and Rb+/− NSCs display similar neuronal differentiation rates after 2 d and 5 d in culture. Error bars represent SD of measurements from at least n = 3 per genotype and asterisks indicate a statistically significant difference between genotypes using independent samples t-tests. Scale bar = 100 uM.

