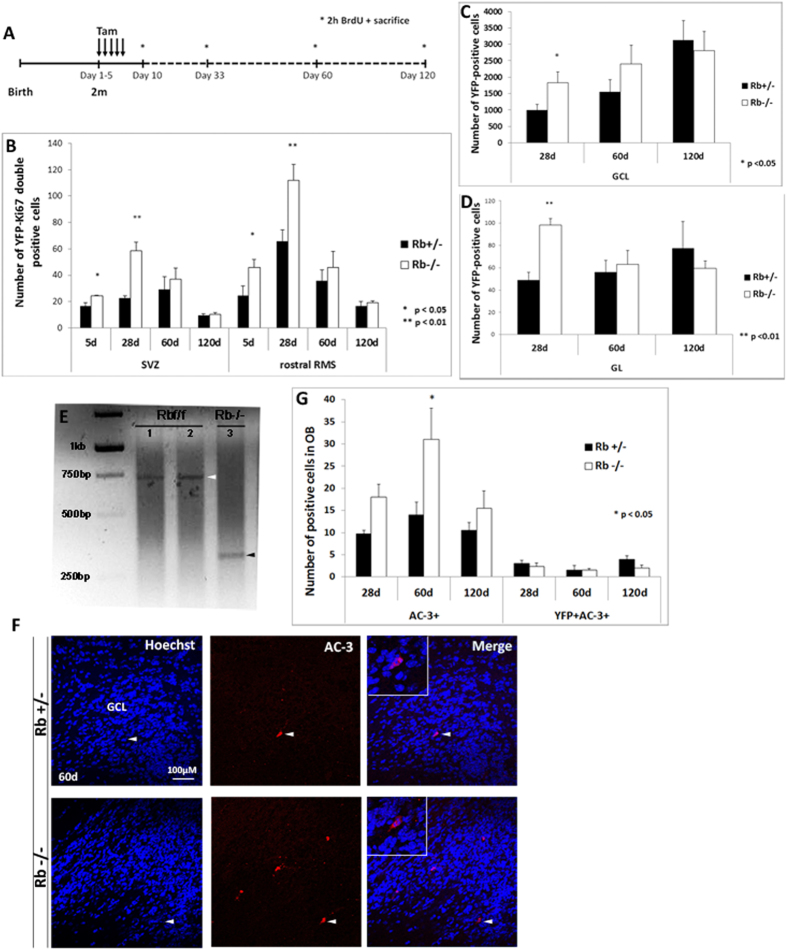
Figure 7. Rb is required for long-term survival of adult-born neurons in the OB.
(A) Experimental design for the acute deletion of Rb performed in 2-month-old animals. Asterisks depict the distinct time-points of sacrifice. (B) Graph depicts the number of [YFP+Ki67+] cells in the SVZ and the RMS at distinct-time points in Rb−/− versus Rb+/− animals (n = 3Ct and 3Mut). Progenitor proliferation reaches a peak around 28 d in both regions but gradually decreases thereafter in both genotypes. (C,D) Graphs illustrate the number of YFP+ cells detected in the GCL (C) and GL (D) in Rb−/− vs Rb+/− mice after distinct survival periods (n = 3Ct and 3Mut). Despite the significant increase in the number of YFP+ cells found in the OBs in Rb-null brains compared with controls at 28 d, there is a gradual decrease in these cells in both layers in the absence of Rb at later stages with respect to controls. (E) YFP+ cells were sorted from Rbflox/flox OBs at 120 d post-tamoxifen treatment (n = 6Mut) and genotyped by PCR showing that they were not Rb-null (lanes 1 and 2; white arrowhead) compared with sorted/Rb-null YFP+ cells derived in culture from 5 d dissected SVZ (lane 3; positive control, black arrowhead). (F) Active-caspase 3 (AC-3) staining showing a significant increase in cell death at 60 d leading to the gradual loss of Rb-null newborn neurons between 28 d and 120 d post-treatment. White arrowheads indicate double positive cells shown at higher magnification in the insets. (G) Quantification of data shown in (F) at distinct survival periods. Error bars represent SD of measurements from n = 3 per genotype and per time-point and asterisks indicate a statistically significant difference between genotypes using independent samples t-tests. Scale bar = 100 uM.

