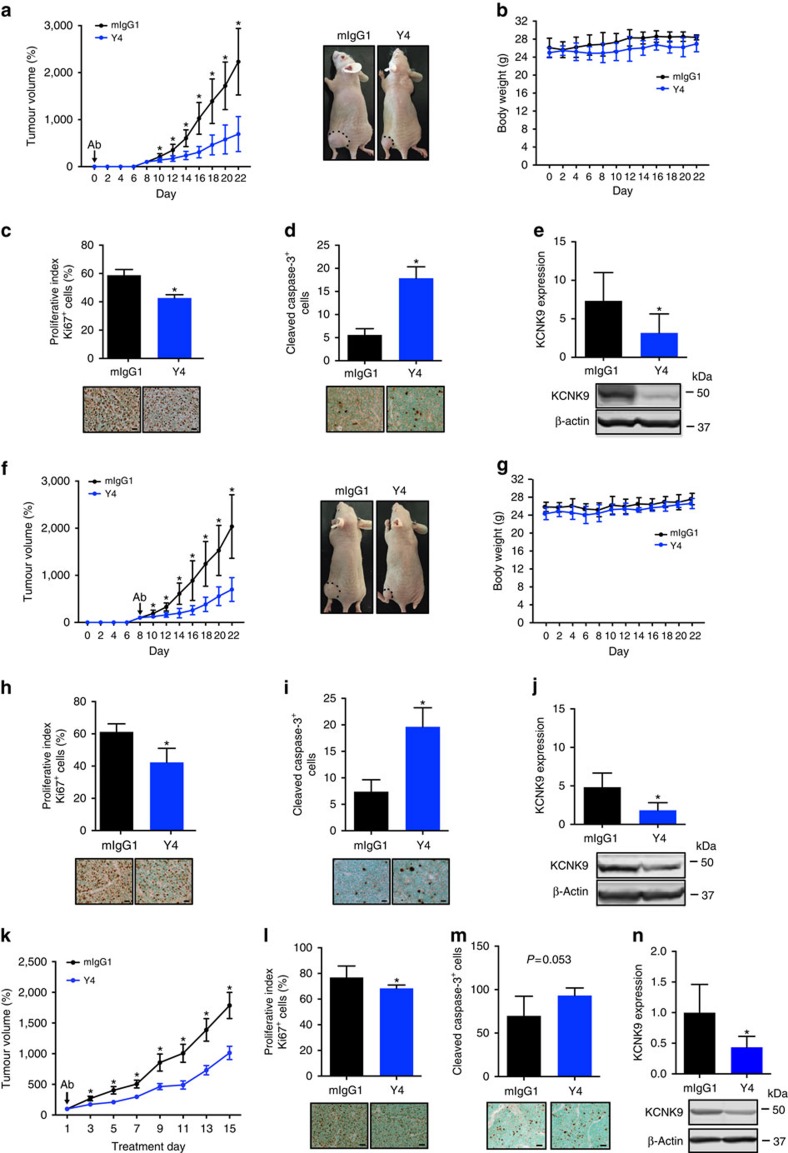
Figure 5. Y4 inhibits the capacity of BEN cells to propagate subcutaneous tumour xenografts.
(a) Growth curves of BEN engraftments in nu/nu mice treated with mIgG1 or Y4 i.p. twice a week for 22 days. Mean±s.d., n=10 per group, *P<0.01, two-tailed Student's t-test. mAb treatment started on the same day of cell injection. Representative photographs showing tumours (dotted line) formed on day 22. (b) Body weights of mice. Mean±s.d., n=10 per group. (c) Quantitative determination of Ki67+ cells and representative staining of tumour cross-sections. Mean±s.d., n=30, *P<0.01, two-tailed Student's t-test; scale bar, 1,000 μm. (d) Quantitative determination of cleaved caspase-3+ cells and staining photographs of tumour cross-sections. Mean±s.d., n=30, *P<0.01, two-tailed Student's t-test; scale bar, 1,000 μm. (e) Quantitative determination of hKCNK9 and representative western blotting of tumour tissues. Mean±s.d., n=10, *P<0.05, two-tailed Student's t-test. (f) Growth curves of BEN engraftments in nu/nu mice treated with mIgG1 or Y4 i.p. twice a week for 14 days. Mean±s.d., n=10 per group, *P<0.01, two-tailed Student's t-test. mAb treatment started after tumour was measurable on day 8. Representative photographs showing tumours (dotted line) formed on day 22. (g) Body weights of mice. Mean±s.d., n=10 per group. (h) Quantitative determination of Ki67+ cells and representative staining of tumour cross-sections. Mean±s.d., n=30 per group, *P<0.01, two-tailed Student's t–test; scale bar, 1,000 μm. (i) Quantitative determination of cleaved caspase-3+ cells and representative staining of tumour cross-sections. Mean±s.d., n=30 per group, *P<0.01, two-tailed Student's t-test; scale bar, 1,000 μm. (j) Quantitative determination of hKCNK9 and representative western blotting of tumour tissues. Mean±s.d., n=10 per group, *P<0.05, two-tailed Student's t-test. (k) Growth curves of LX22 patient-derived xenograft (PDX) engraftments in NSG mice treated with mIgG1 or Y4 i.p. twice a week for 15 days. Mean±s.e.m., n=10 per group, *P<0.01, two-tailed Student's t-test. (l) Quantitative determination of Ki67+ cells and representative staining of tumour cross-sections. Mean±s.d., n=30 per group, *P<0.05, two-tailed Student's t-test; scale bar, 1,000 μm. (m) Quantitative determination of cleaved caspase-3+ cells and representative staining of tumour cross-sections. Mean±s.d., n=30 per group; scale bar, 1,000 μm. (n) Quantitative determination of hKCNK9 and representative western blotting of tumour tissues. Mean±s.d., n=10 per group, *P<0.05, two-tailed Student's t-test.

