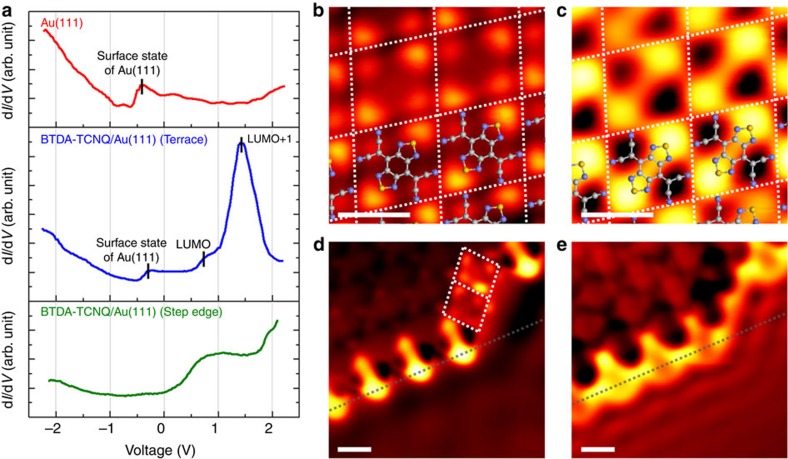
Figure 4. STS spectra and STS mapping images of BTDA-TCNQ/Au(111).
(a) STS spectra of (top) the bare Au(111) surface, (middle) the BTDA-TCNQ molecule on the Au(111) terrace and (bottom) the BTDA-TCNQ molecule at the Au(111) step edge. (b,c) STS mapping images of BTDA-TCNQ on the Au(111) terrace. The electron probability distributions are clearly observed for the LUMO state of BTDA-TCNQ in b (Vs=800 mV, It=0.8 nA, S=1.0 nm) and the LUMO+1 state of BTDA-TCNQ in c (Vs=1,500 mV, It=0.8 nA, S=1.0 nm). Each BTDA-TCNQ molecule is enclosed with white dotted lines in b and c. (d,e) STS mapping images of BTDA-TCNQ at the Au(111) step edge. Parallel straight lines of the step edge are indicated by grey dotted lines in d and e, and the BTDA-TCNQ molecules that are rearranged onto the lower terrace from the step edge are enclosed with white dotted lines in d. The STS mapping image in d (Vs=500 mV, It=1.0 nA, S=1.0 nm) reveals the LUMO state for BTDA-TCNQ with the rearranged flat-lying adsorption structure and the LUMO+1 state for BTDA-TCNQ with the slanting adsorption structure at the lower sample bias than that in b and c. The STS mapping image in e (Vs=2,000 mV, It=1.0 nA, S=1.0 nm) also indicates that the unoccupied MO states of BTDA-TCNQ are highly hybridized with the Au surface at the step edge, forming quasi-1D electron dispersion along the step-edge line.

