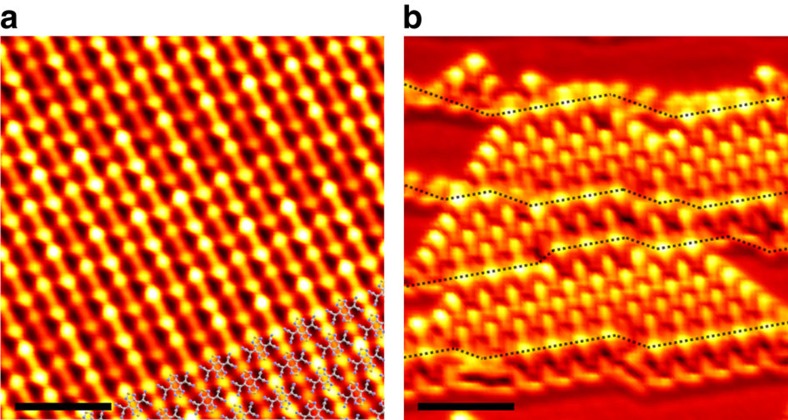
Figure 6. Widely uniform anisotropic MO states of BTDA-TCNQ/Au(111).
(a,b) STS mapping images of an SMC of BTDA-TCNQ on the Au(111) surface in the energy range corresponding to the LUMO+1 state (Vs=1,500 mV, It=1.0 nA). Widely uniform anisotropic MO states of the SMC are clearly observed in a (S=3.0 nm), which can be extended over multiple surface steps and terraces as in b (S=5.0 nm). Step-edge lines are indicated with black dotted lines in b, revealing small sizes (∼5 nm in width) of the (111) facets.

