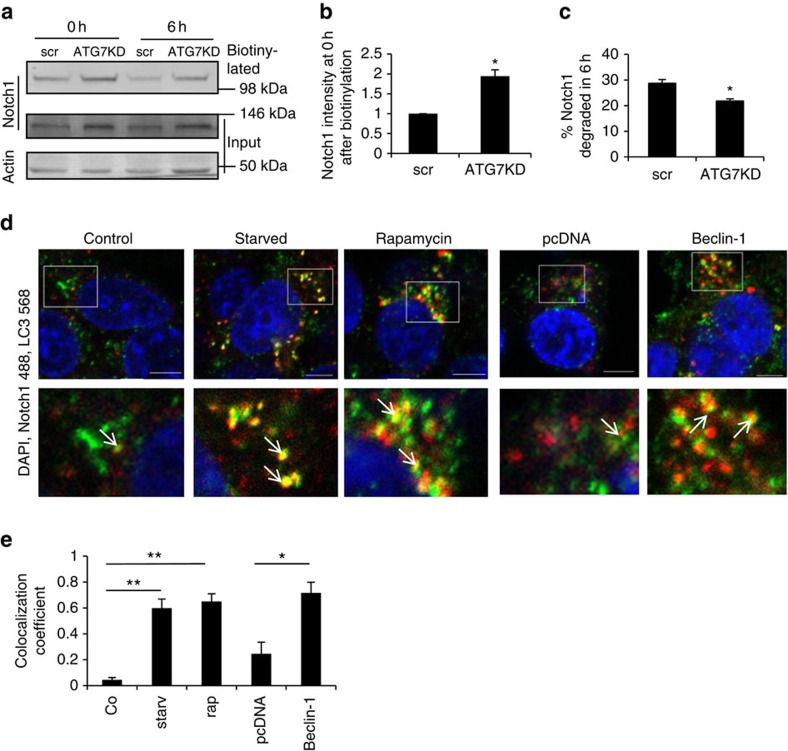
Figure 2. Autophagy regulates Notch1 degradation.
(a) Effect of autophagy inhibition on degradation of Notch1 was assessed by biotinylation assay in HEK cells treated with ATG7 siRNA (ATG7KD). The cell surface proteins were biotinylated and cells were immediately collected or incubated at 37 °C for 6 h to allow internalization and degradation. After lysis, biotinylated proteins were pulled down with streptavidin beads and the amount of biotinylated Notch1 remaining assessed by western blot (top panel). Western blots for total Notch1 levels and actin levels in the input are shown as controls. (b) Quantification of surface Notch1 at time point 0 h after autophagy inhibition. *P<0.05 by paired t-test. n=3. Error bars=s.e.m. (c) Quantification of Notch1 degradation rate. The ratio of 6 h/0 h biotinylated Notch1 level is shown for scrambled siRNA (scr) and ATG7KD samples. *P<0.05 by unpaired t-test. n=3. Error bars=s.e.m. (d) HEK cells were starved with HBSS (2 h) or treated with DMSO (control) /rapamycin or transfected with pcDNA or Beclin-Flag (2 days). Cells were immunostained for Notch1 (green) and LC3 (red) and stained with DAPI (blue). The white box indicates the location of the enlargement. The arrows show LC3 and Notch1 colocalization. Scale bar, 5 μm (e) Colocalization of Notch1 with LC3 from 2 days (starv=starved, rap=rapamycin). Mander's colocalization coefficient was measured using Volocity software. Unpaired t-test **P<0.01. *P<0.05. n=3. Error bars=s.e.m.

