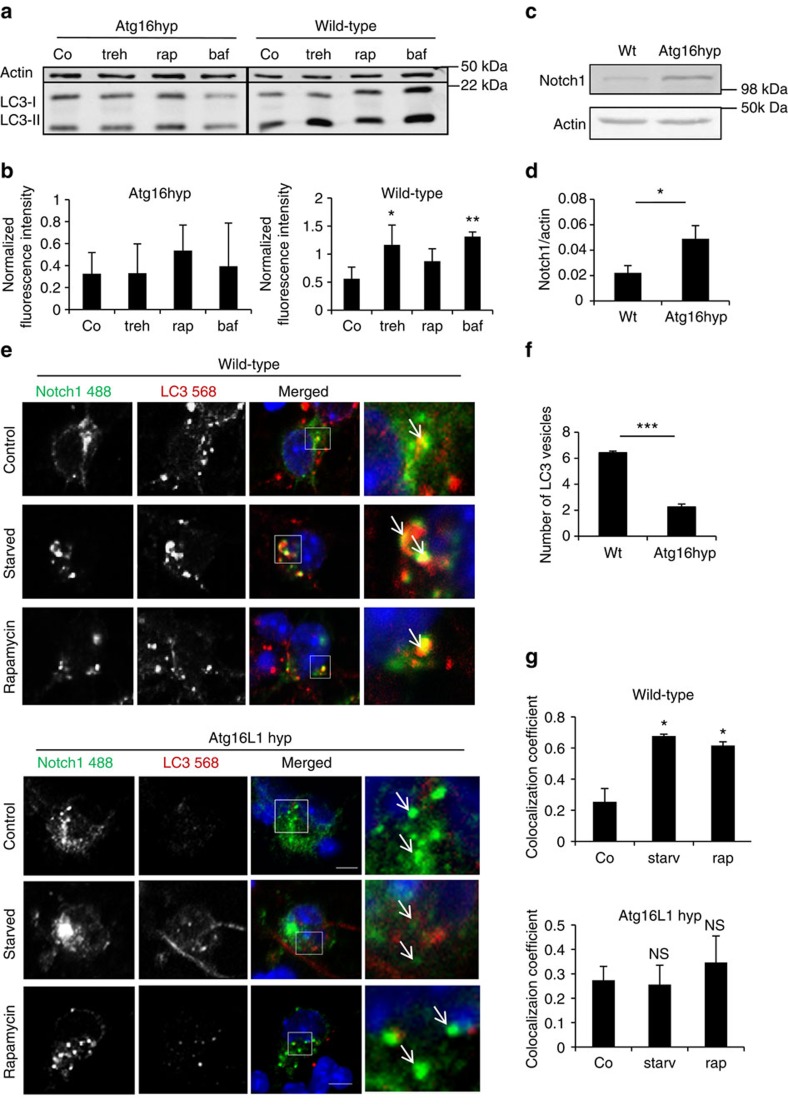
Figure 6. Autophagy modulates Notch1 in primary neurons.
(a) Representative western blot of LC3-II levels in wild-type and Atg16L1 hypomorph (Atg16hyp) mice. E15.5 wild-type and Atg16L1 hyp primary cortical neurons were lysed after treatment with DMSO (Co), trehalose (treh), rapamycin (rap) and bafilomycin A1 (baf) for 8 h and analysed by western blot. (b) LC3-II protein level relative to actin loading control from western blots in a. *P<0.05 and **P<0.01 by unpaired t-test. n=3. Error bars=s.e.m. (c) Representative western blot showing Notch1 level in brain lysates from wild-type and Atg16L1 hyp 5-week-old animals. (d) Quantification of western blots for Notch1 in wild-type and Atg16L1 hypomorph mice (Atg16 hyp). *P<0.05 by unpaired t-test. n=4 mice per group. Error bars=s.e.m. (e) Effect of pharmacological autophagy modulation on the colocalization of Notch1 with LC3 in wild-type (E15.5) and Atg16L1 hyp primary cortical neurons. Neurons were treated with DMSO (Control), starved with HBSS for 2 h or treated with rapamycin (8 h). Arrows denote Notch1 and LC3 colocalization. Scale bar, 5 μm. (f) Number of LC3 vesicles in neurons from wild-type compared to Atg16L1 hypomorph (Atg16hyp) mice. Mean number of LC3 vesicles per cell is shown based on counting vesicles in at least 15 cells per condition ***P<0.001 by unpaired t-test. n=3. Error bars=s.e.m. (g) Mander's colocalization coefficient of Notch1 and LC3 in wild-type and Atg16L1 hyp primary neurons. *P<0.05 or ***P<0.001 by unpaired t-test relative to control (Co). Error bars represent standard error of the mean. n=3. Error bars=s.e.m.

