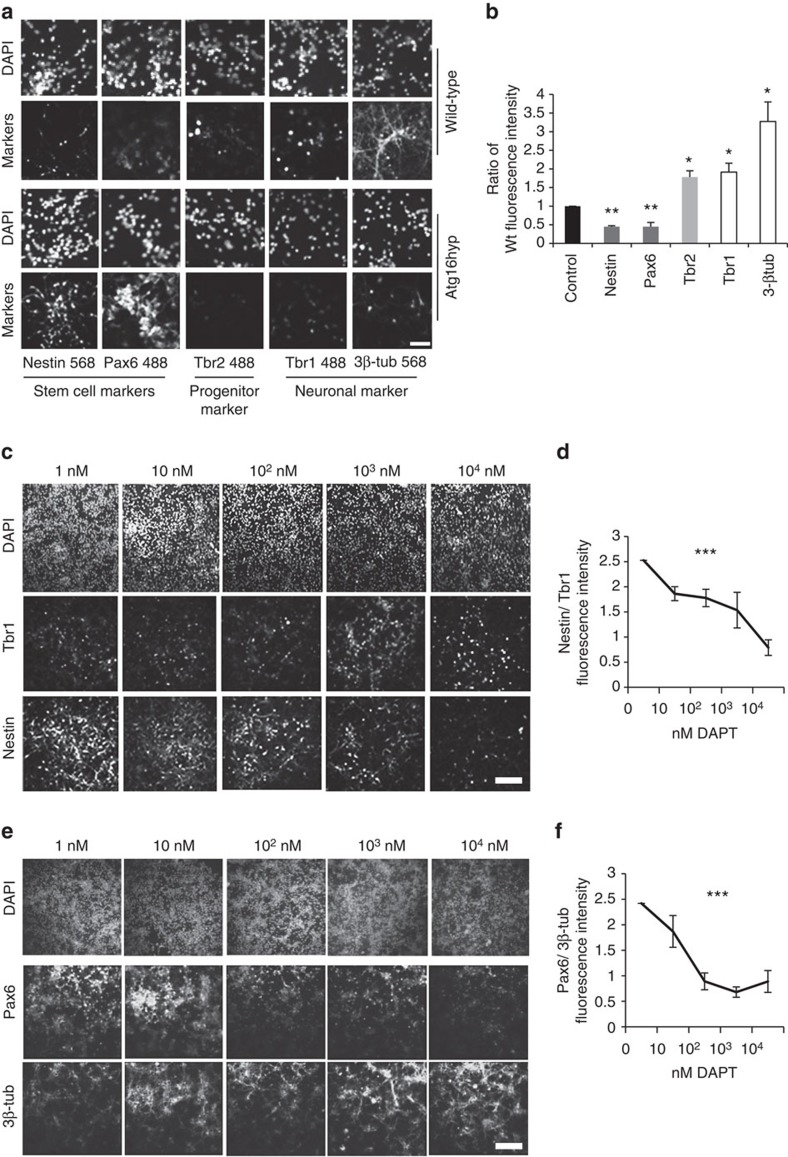
Figure 7. Increased Notch1 in Atg16L1 hyp increases stem cell staining.
(a) Effect of decreased Atg16L1 on differentiation of primary neurons in culture. Wild-type and Atg16L1 hyp primary cortical neurons were stained for stem cell markers (Nestin, Pax6), progenitor marker Tbr2 and neuronal markers (Tbr1, β3-tub). Scale bar=100 μm is valid for all panels. (b) Quantification of relative fluorescence intensity of immunostaining for markers of stem cells (dark grey bars), progenitors (light grey bars) neurons (white bars) as shown in a. Intensity is expressed as a ratio of wild-type (Wt) to Atg16L1 hypomorph (Atg16hyp) *P<0.05 by paired t-test. n=3. Error bars=s.e.m. (c) Effect of Notch pathway inhibition (by DAPT) on the differentiation of Atg16L1 hypomorph primary neurons. Neurons from E15.5 Atg16L1 hypomorph (Atg16hyp) mice were treated with increasing concentration of DAPT and stained for Nestin and Tbr1. Scale bar, 200 μm is valid for all panels. (d) Quantification of fluorescence intensity of immunostaining for stem cell marker Nestin and neuronal marker Tbr1 in neuronal cultures from Atg16L1 hypomorph mice following DAPT treatment at different concentrations as shown in c. The values are shown as a ratio of stem cell marker relative to neuronal marker to correct for any differences in cell number. ***P<0.001 by analysis of variance. n=3. Error bars=s.e.m. (e) Effect of Notch pathway inhibition (by DAPT) on the differentiation of Atg16L1 hypomorph primary neurons. Neurons from E15.5 Atg16L1 hypomorph (Atg16hyp) mice were treated with increasing concentration of DAPT and stained Pax6 and 3β-tub. Scale bar, 200 μm is valid for all panels. (f) Quantification of stem cell marker Pax6 relative to neuronal marker 3β-tub as described in e. n=3. Error bars=s.e.m.

