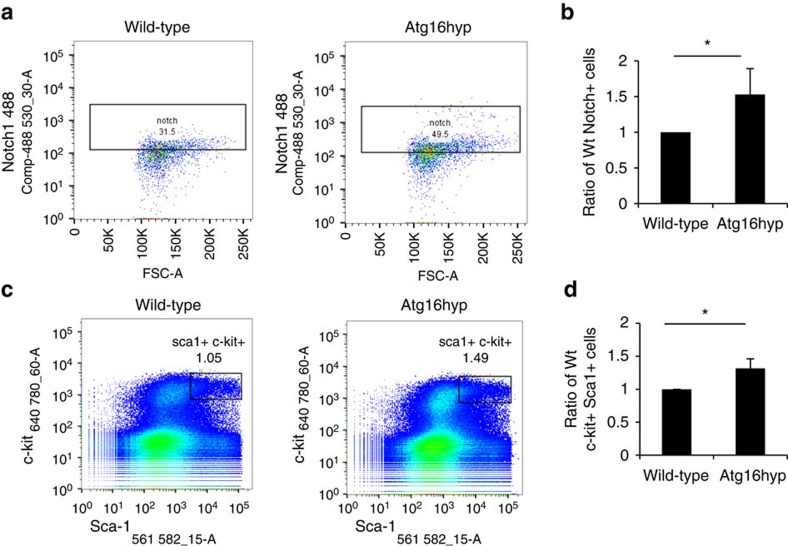
Figure 9. Delayed bone marrow/gut differentiation in Atg16L1 hypomorphs.
(a) Dot plots showing representative FACS analysis of Notch1 level in the stem cell population of bone marrow cells isolated from 6 week old wild-type and Atg16hyp mice. Stem cell population was gated and defined as 7AAD-negative, lineage-negative, c-kit-positive and Sca1-positive and Notch1-positive cells. Percentage of stem cells positive for Notch1 above an arbitrary threshold value is shown. (b) The per cent of cells staining positive for Notch1 (as described in a). The graph shows the ratio of Notch1-positive cells gated in Atg16L1 hypomorph (Atg16hyp) to wild-type (Wt) gated cells. *P<0.5 by paired t-test. n=6. Error bars=s.e.m. (c) Effect of decreased ATG16L1 levels on differentiation of bone marrow stem cells. Representative dot plots from FACS analysis of bone marrow cells from 6 weeks old wild-type and Atg16L1 hypomorph (Atg16hyp) mice. The black box indicates the gated population identified as stem cells, defined as 7AAD-negative, lineage-negative, c-kit-positive and Sca1-positive cells. (d) Quantification of gated population of stem cells as illustrated in c. The ratio of Atg16L1 hypomorph (Atg16hyp) gated cells to wild-type (Wt) gated cells is shown. *P<0.5 by paired t-test. n=9. Error bars=s.e.m.

