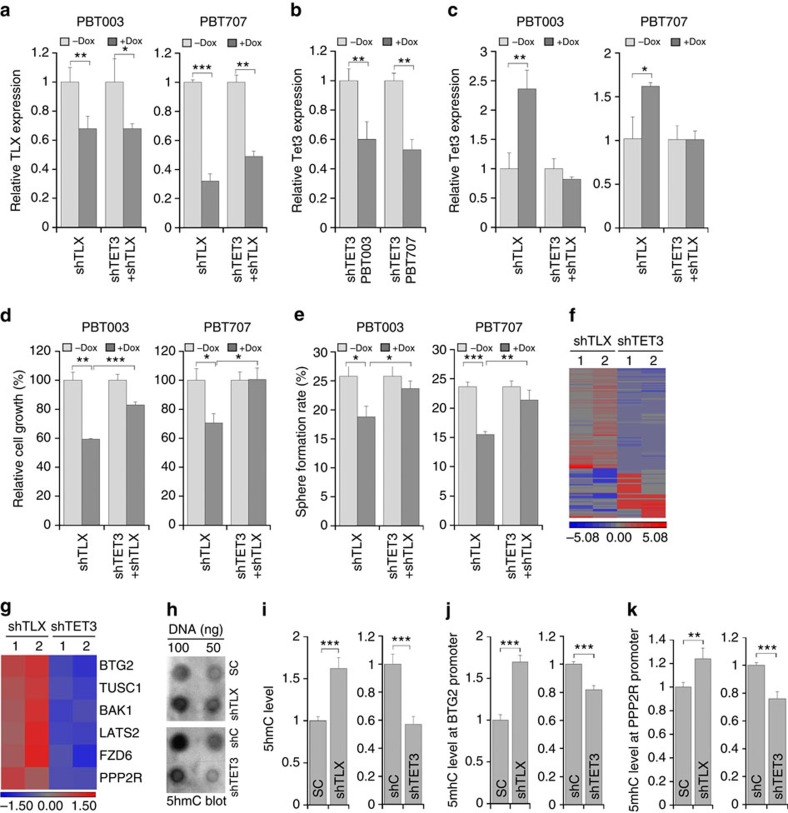
Figure 8. TET3 acts downstream of TLX to regulate GSC growth and self-renewal.
(a–c). RT–PCR analysis of dox-induced knockdown of TLX (a) and TET3 (b,c) in PBT003 and PBT707 cells transduced with lentivirus expressing dox-inducible TLX shRNA (shTLX) and or with dox-inducible TET3 shRNA (shTET3 or shTET3+shTLX). N=3, error bars are s.d. of the mean. *P<0.05, **P<0.01, ***P<0.001 by Student's t-test for all the quantifications in this figure. (d,e) Cell growth (d) and sphere formation (e) analyses of PBT003 and PBT707 cells transduced with lentivirus expressing dox-inducible shTLX alone or together with dox-inducible shTET3. N=4 for d and N=6 for e, error bars are s.e. of the mean. (f) Heat map of differentially expressed genes in PBT003 cells transduced with virus expressing TLX shRNAs (shTLX1, shTLX2) or TET3 shRNAs (shTET3-1, shTET3-2), in microarray analysis. (g) Heat map of six differentially expressed genes in PBT003 cells transduced with virus expressing TLX shRNAs (shTLX1, shTLX2) or TET3 shRNAs (shTET3-1, shTET3-2), in microarray analysis. (h,i) 5hmC dot blot analysis of total 5hmC level in TLX knockdown or TET3 knockdown PBT003 cells. (j,k) Hydroxymethylated DNA immunoprecipitation (hMeDIP)-qPCR analysis of BTG2 and PPP2R1B (PPP2R) promoter in PBT003 cells transduced with virus expressing shTLX or shTET3. N=4, error bars are s.d. of the mean.

