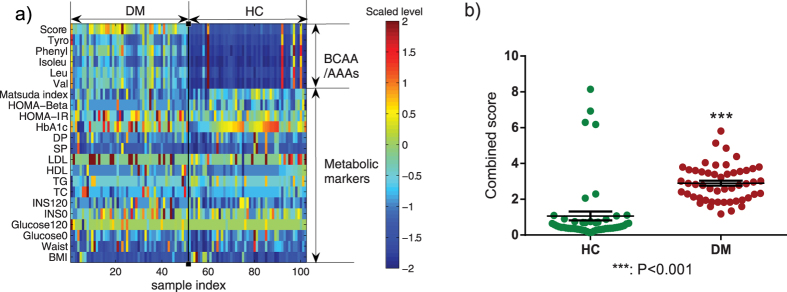
Figure 1.
Heat map of AA and metabolic marker levels (a) and scatter plot of combined score (b) in individuals of healthy control (HC) and diabetes (DM) from longitudinal study. Abbreviations used: Score, the first decomposed principal component derived from the abundance of the five AAs; DM, future diabetes; DP, diastolic blood pressure; Glucose0, fasting glucose; Glucose120, 2 h glucose; HC, future healthy controls; HDL, high-density lipoprotein-cholesterol; HOMA-Beta = 20*INS0/(Glucose0-3.5); HOMA-IR = Glucose0*Glucose120/22.5; INS0, fasting insulin; INS120, 2 h insulin; Isoleu, isoleucine; LDL, low-density lipoprotein-cholesterol; Leu, leucine; Matsuda index = 10000/(Glucose0*Glucose120*INS0*INS120)1/2; Phenyl, phenylalanine; SP, systolic blood pressure; TC, total cholesterol; TG, triglyceride; Tyro, tyrosine; Val, valine.

