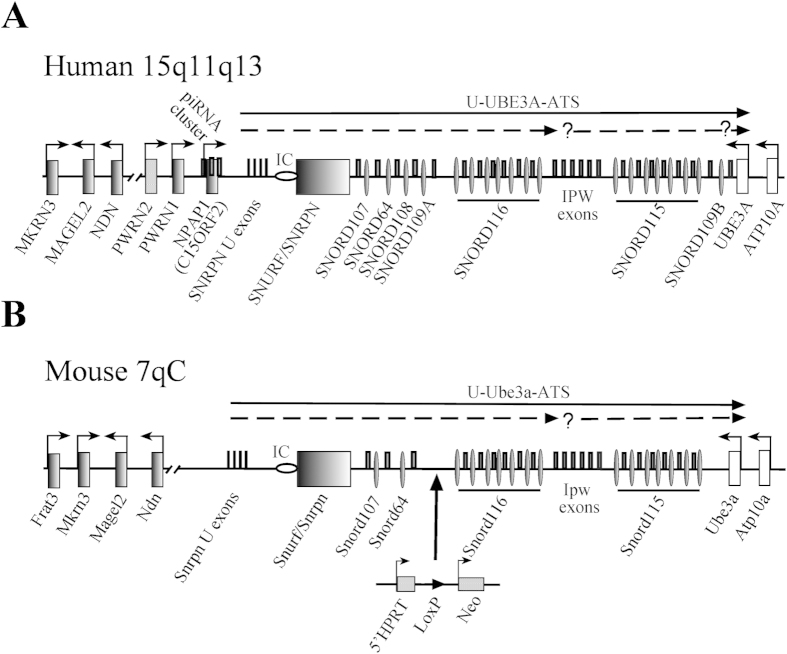
Figure 1. Schematic representation of the PWS-locus in human and mice.
(A) Human chromosome 15q11-q13 region (not drawn to scale). Rectangles or thin ovals denote protein coding gene or snoRNA gene locations and the imprinting center (IC) is shown by a horizontal oval; thin rectangles above the midline denote non-protein coding exons. Arrows indicate promoters and the direction of transcription. The two broken arrows under the top arrow showing the U-UBE3A antisense transcript harboring the two SNORD116 and SNORD115 clusters indicate putative additional primary transcripts with a possible additional promoter upstream from the SNORD115 cluster. (B) Schematic representation of the mouse PWS-locus on chromosome 7; the 5′HPRT-LoxP-NeoR targeting cassette is indicated (not drawn to scale).

