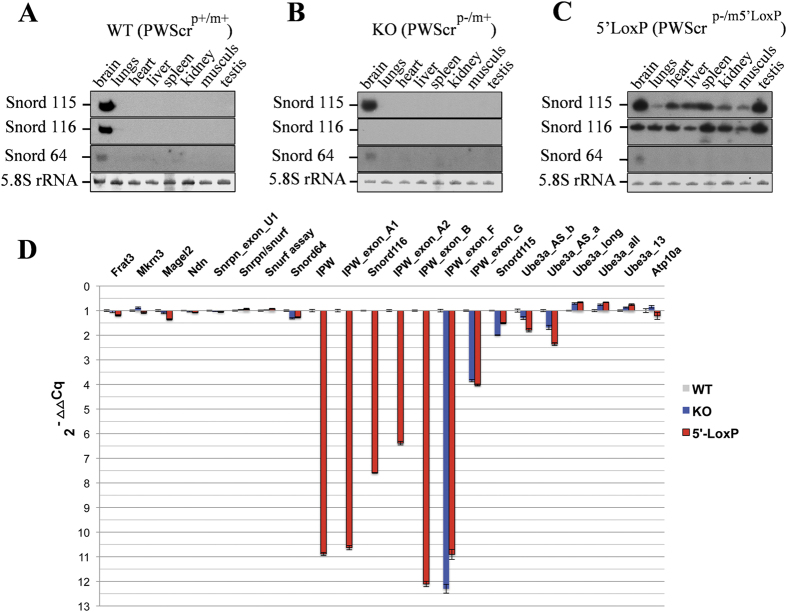
Figure 3. Expression of PWS/AS locus genes in PWScrp−/m5′LoxP, PWScrp−/m+ and wild type mice.
(A–C) Northern blot analyses of PWS-locus snoRNAs from different tissues of wild type, PWScrp−/m+ and PWScrp−/m5′LoxP mice. Ethidium bromide-stained 5.8 S rRNA is shown as RNA loading control. Tissues and mouse genotypes are indicated on the top of each blot panel. (D) RT-qPCR analysis of PWS/AS-locus genes; the fold change is represented as 2−ΔΔCq. Blue and red bars represent the RNAs expression fold change values of PWScrp−/m+ and PWScrp−/m5′LoxP mice, respectively. The plot represents values of Supplementary Table 2.

