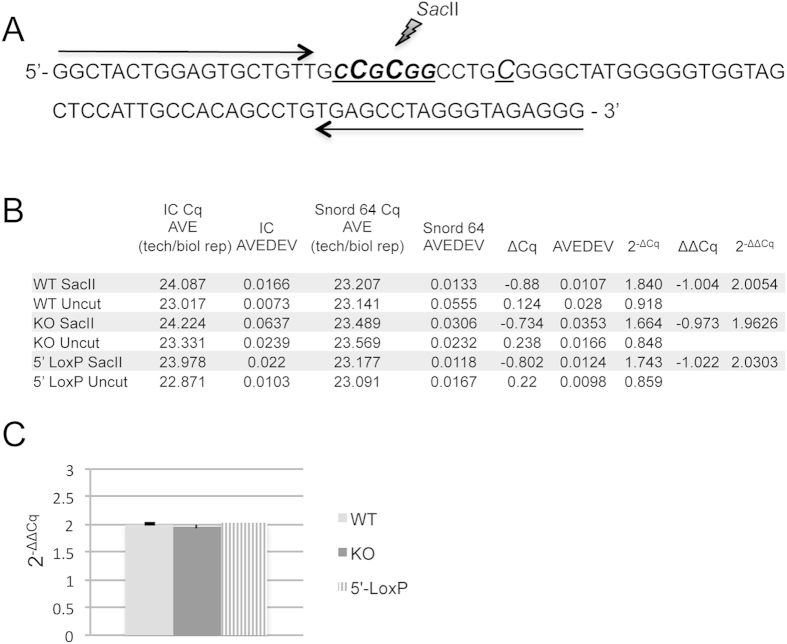
Figure 4. PWS-IC-center CpG methylation analysis.
(A) The mouse PWS-IC genomic region selected for the qPCR assay; cytosine residues that are methylated on the maternal chromosome are shown as capitalized, underlined and italic letters. The SacII endonuclease recognition site is CCGCGG. Quantitative PCR primers are indicated by a black arrows. (B) A summary of the qPCR data is detailed in Supplementary Table 4. For each mouse genotype (WT: wild type; KO: PWScrp−/m+ and 5′ LoxP: PWScrp−/m5′LoxP), six brains were used to isolate DNA samples. Each sample was analysed in triplicate. DNA samples either digested and untreated are indicated by SacII and Uncut respectively. Columns: IC Cq AVE (tech/biol rep) is the average of Cq values obtained from technical and biological replicates per category during the qPCR of the PWS-IC region; IC AVEDEV is the average of standard deviations obtained from all replicates per category during qPCR of the PWS-IC region; Snord64 Cq AVE (tech/biol rep): the average of Cq values obtained during qPCR of the Snord64 gene region; Snord64 AVEDEV: is the respective average standard deviation. (C) Chart visualising 2−ΔΔCq values obtained by qPCR show no differences in CpG methylation of the PWS-IC region among the different mouse genotypes.

