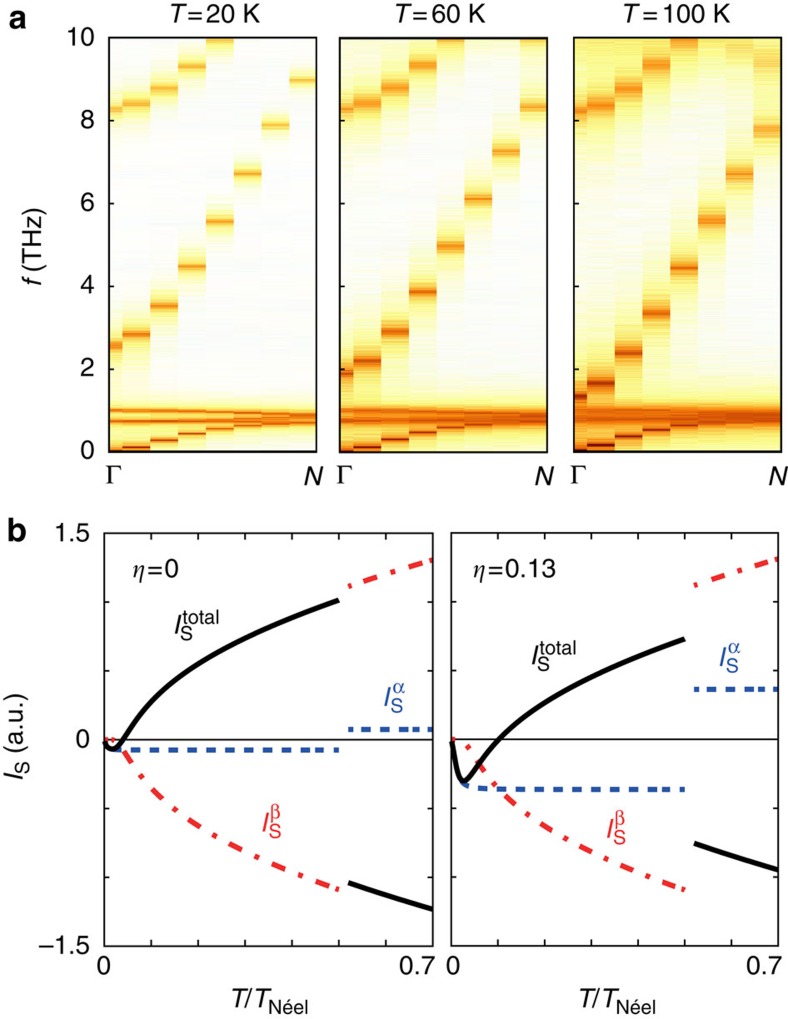
Figure 4. Calculated spin wave spectra of GdIG and sublattice spin currents injected by the SSE.
(a) Low-frequency spin wave spectra of GdIG calculated from an atomistic model for three different temperatures. The colour code indicates the power spectral density. For temperatures lower than 300 K, the SSE is dominated by two modes: a uniform precession mode in the GHz regime (α-mode) and a gapped, optical mode (β-mode). The two nearly dispersionless modes around 1 THz are the Gd moments precessing in the exchange field of the Fe moments. (b) Temperature dependence of the spin current  (red) and
  (blue) caused by the respective magnon modes. The total spin current
  (black) determines the SSE.
  takes the different interface exchange couplings at the GdIG/Pt interface into account. The ratio between these couplings is given by η.

