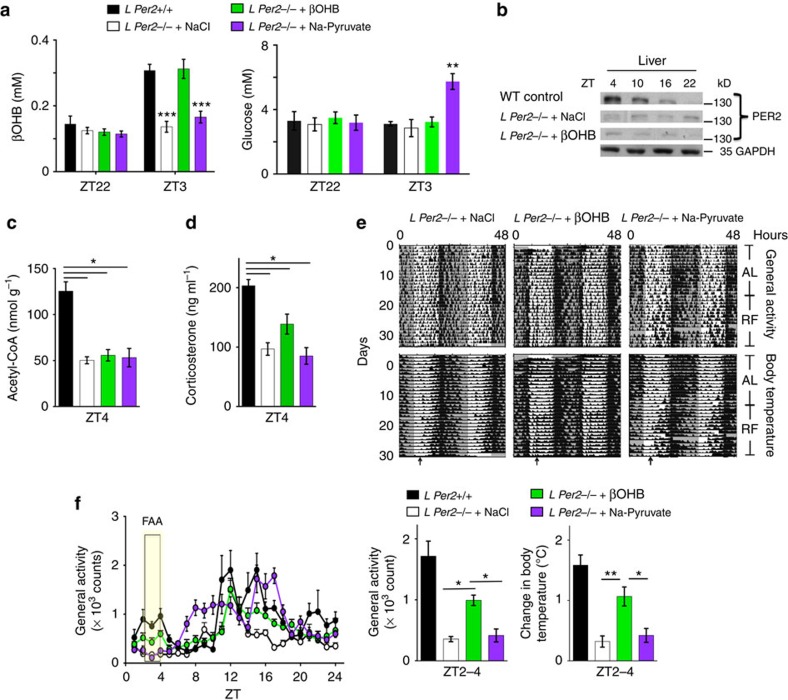
Figure 4. Rescue of food anticipation in L Per2−/− mice by β-hydroxybutyrate.
(a) Timed release of βOHB (green) but not NaCl (white) or Na-Pyruvate (purple) in L Per2−/− mice mimics the βOHB levels in plasma of L Per2+/+ control animals (black). Measured after 15 days of infusion. (b) Western blot showing PER2 levels in the liver after application of NaCl and βOHB, respectively. (c) Acetyl-CoA levels in liver extracts of βOHB treated (green), NaCl-treated (white), Na-Pyruvate treated (purple), and control animals (black). (d) Corticosterone levels in plasma of βOHB treated (green), NaCl-treated (white), Na-Pyruvate treated (purple), and control animals (black). (e) Examples of double plotted activity and body temperature profiles of NaCl-treated, βOHB-treated, and Na-Pyruvate treated, L Per2−/− mice. Arrows indicate food access. (f) Left: quantification of the activity profile (n=4–6), yellow rectangle represents ZT2–4, 2 h prior to food access. Right: quantification of activity and body temperature, respectively, before food access (n=4–6). All values are mean±s.e.m. One-way ANOVA with Tukey's post test. *P<0.05, **P<0.01, ***P<0.001. ANOVA, analysis of variance.

