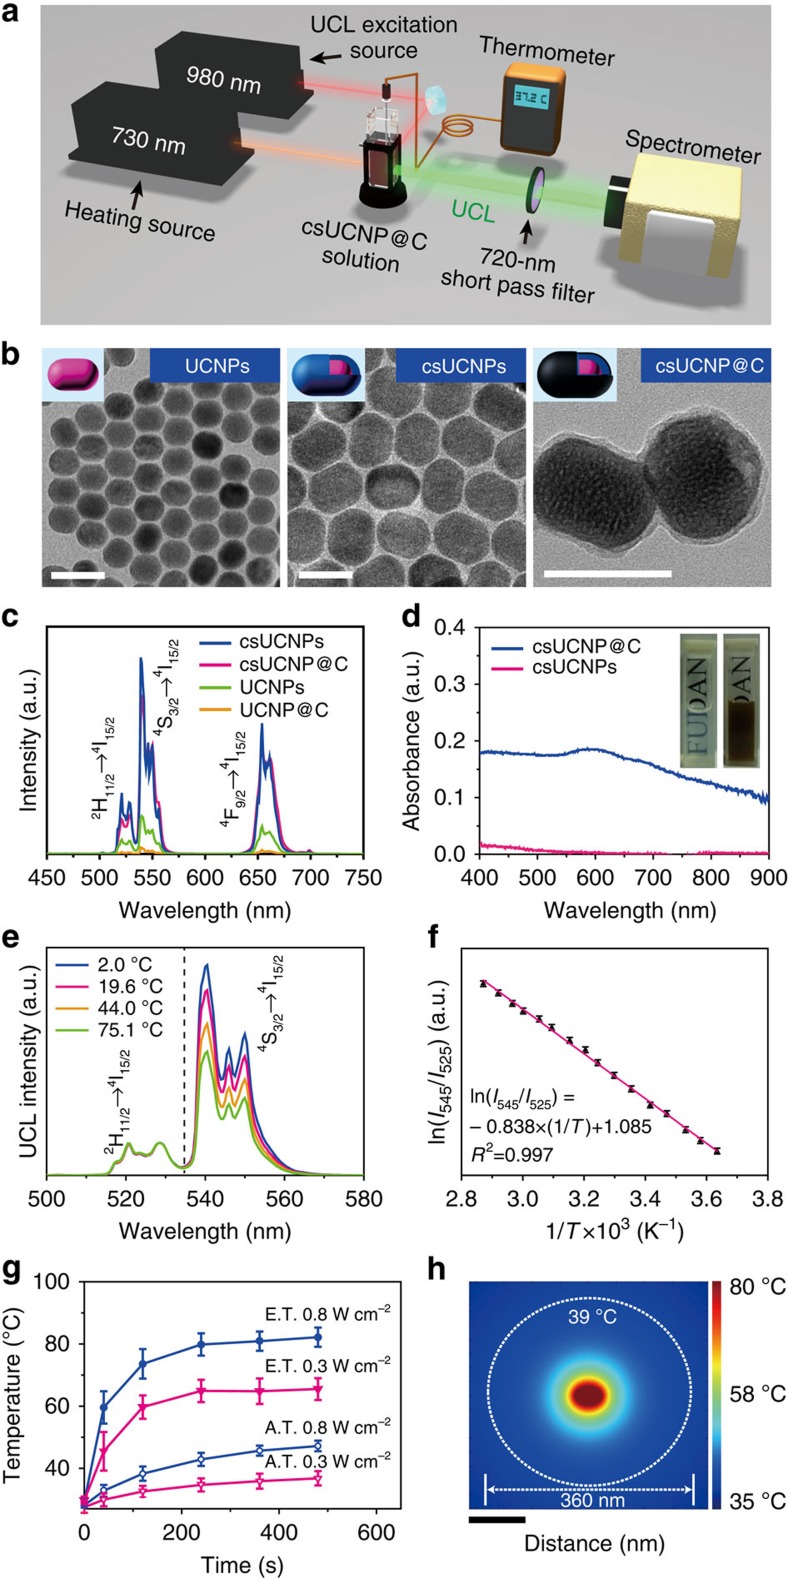
Figure 2. Characterization and temperature-sensing properties of csUCNP@C.
(a) Schematic diagram of the detection of the eigen temperature of csUCNP@C. (b) TEM images of UCNPs (left), csUCNPs (middle) and csUCNP@C (right). Scale bar, 50 nm. (c) UCL emission spectra of UCNPs, UCNPs@C, csUCNPs and csUCNP@C in the aqueous dispersion with the same concentration of luminescence centre Er3+. (d) Powder absorption spectra of csUCNPs and csUCNP@C. (e) UCL emission spectra of Er3+-doping csUCNP@C at different temperatures by external heating. The peaks were normalized at 528.5 nm. (f) A plot of ln(I525/I545) versus 1/T to calibrate the thermometric scale for csUCNP@C. I525 and I545 indicate the UCL emission of the 2H11/2 → 4I15/2 and 4S3/2 → 4I15/2 transitions, respectively. Average values of I525/I545 under different temperature were given to fit the calibration curve based on three times measurements of UCL spectrum. Error bars were defined as s.d. (g) Elevation of apparent temperature (A.T.) and eigen temperature (E.T.) of csUCNP@C (1 mg ml−1) in aqueous dispersion under irradiation with a 730-nm laser at 0.8 and 0.3 W cm−2. Average value of A.T. and E.T. under different time points were given based on three times measurements. Error bars were defined as s.d. (h) Finite element method (FEM) simulation of the heat conduction of a single csUCNP@C nanoparticle induced by the photothermal process. Scale bar, 100 nm.

