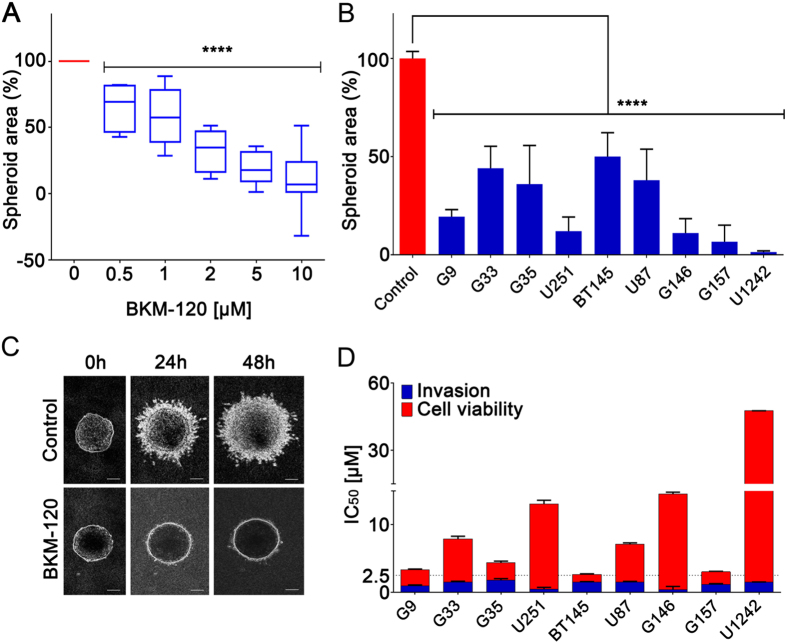
Figure 1. BKM-120 inhibits invasion in a dose-dependent manner in GBM cell lines.
(A) The graph represents an average of the effects of BKM-120 on nine different GBM cell lines and GSCs. (B) Effect of increasing concentrations of BKM-120 in spheroid invasion assays in a panel of GBM cell lines. Invasion was measured after 48 hours of BKM-120 treatment and is expressed as sphere area as a percentage of controls. (C) Image of G9 spheroids after treatment with 2 μM BKM-120 (bar = 100 μm) (lower panel) compared with controls (upper panel). (D) Invasion (blue) and cell viability (red) IC50 values for BKM-120. IC50 was calculated using data from a range of BKM-120 concentrations. Measurements were obtained at 48h of treatment. One-way ANOVA was used for statistical analysis (****p < 0.0001).

