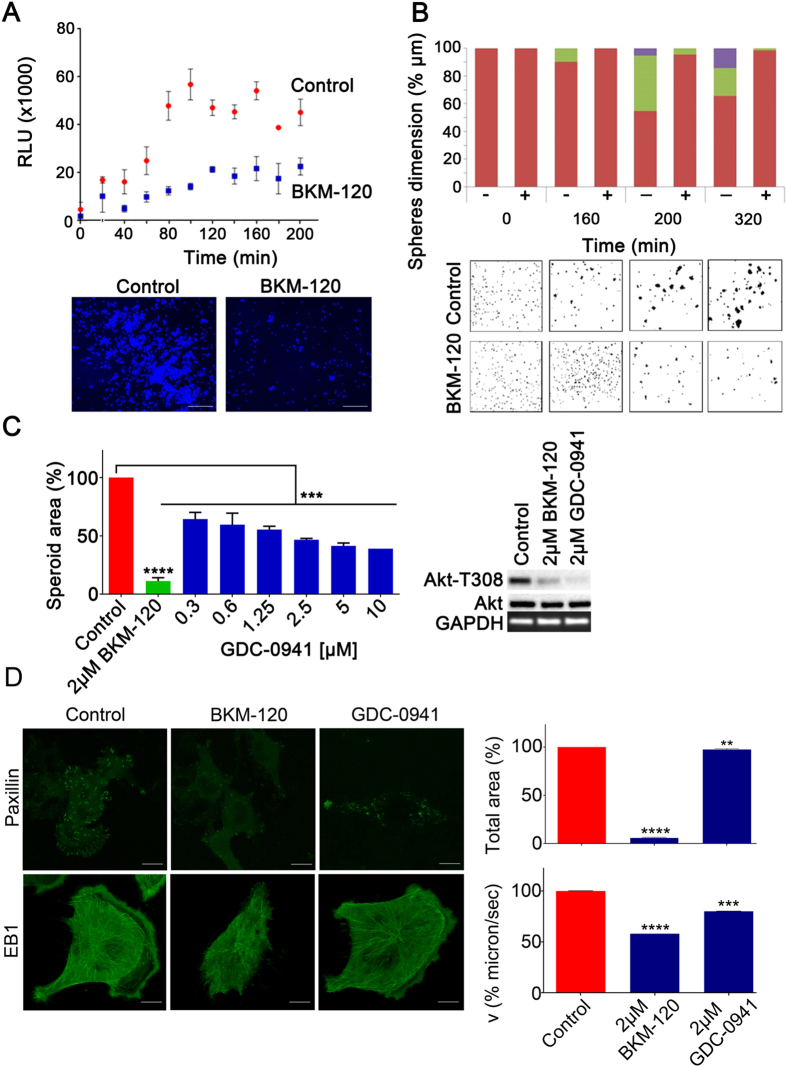
Figure 3. BKM-120 reduces GBM cell adhesion, focal adhesions and microtubule dynamics.
(A) Cell-substrate adhesion was evaluated using G9-copGFP GSCs as described in Materials and Methods. Measurements were taken as luminescence output, RLU (relative light units), every 20 minutes over a time course of 200 minutes. The lower panel shows DAPI staining of G9-copGFP GSCs at the final time-point (200 min, bar = 500 μm). (B) Cell-cell adhesion in G9-copGFP GSCs. Sphere dimensions are indicated as a percentage relative to controls at the indicated time-points. The sphere dimension range is color coded in red for <3000 μm (1), green for 3000 - 6000 μm (2) and violet > 6000 μm (3). (C) Left panel: spheroid invasion assay on G9-copGFP GSCs with 2 μM of BKM-120 and a range of GDC-0941 concentrations. Invasion was measured after 48 hours and is expressed as percentage of spheroid area compared to controls. Right panel: Akt phosphorylation levels were measured by Western blot after 30 minutes treatment with 2 μM of BKM-120 or GDC-0941. (D) U251-paxillin-GFP images (bar = 20 μm) and U251-EB1-GFP time-lapse (bar = 10 μm) at 24h after DMSO, BKM-120 or GDC-0941 treatment. The total area of the paxillin-GFP signal and the velocity (microns/sec) of EB1 were measured using ImageJ. Each measurement was made in triplicate. One-way ANOVA was used for statistical analysis (**p < 0.01, ***p < 0.001, ****p < 0.0001).

