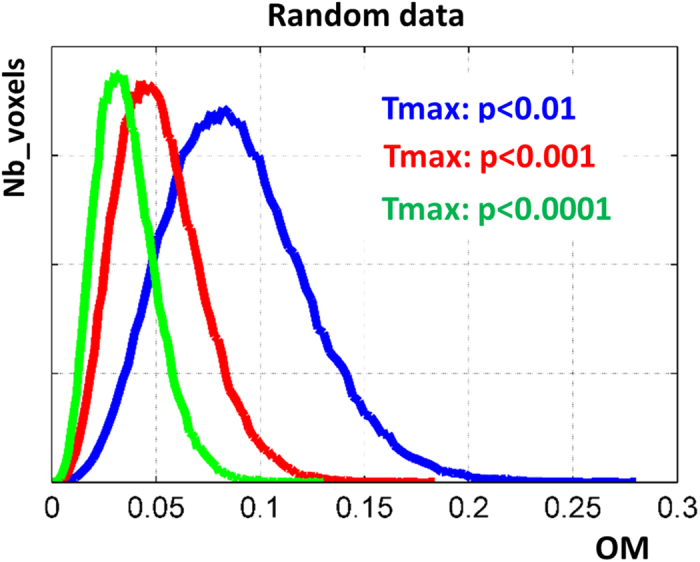
Figure 3. Illustrates the distribution of OM values of all voxels for random responses (blue, red and green histograms correspond to OM maps for Tmax equivalent to p < 0.01, p < 0.001, and p < 0.0001 uncorrected respectively).

The Tmax value used during the generation of OM maps for our tasks is equivalent to p < 0.001 (red curve).
