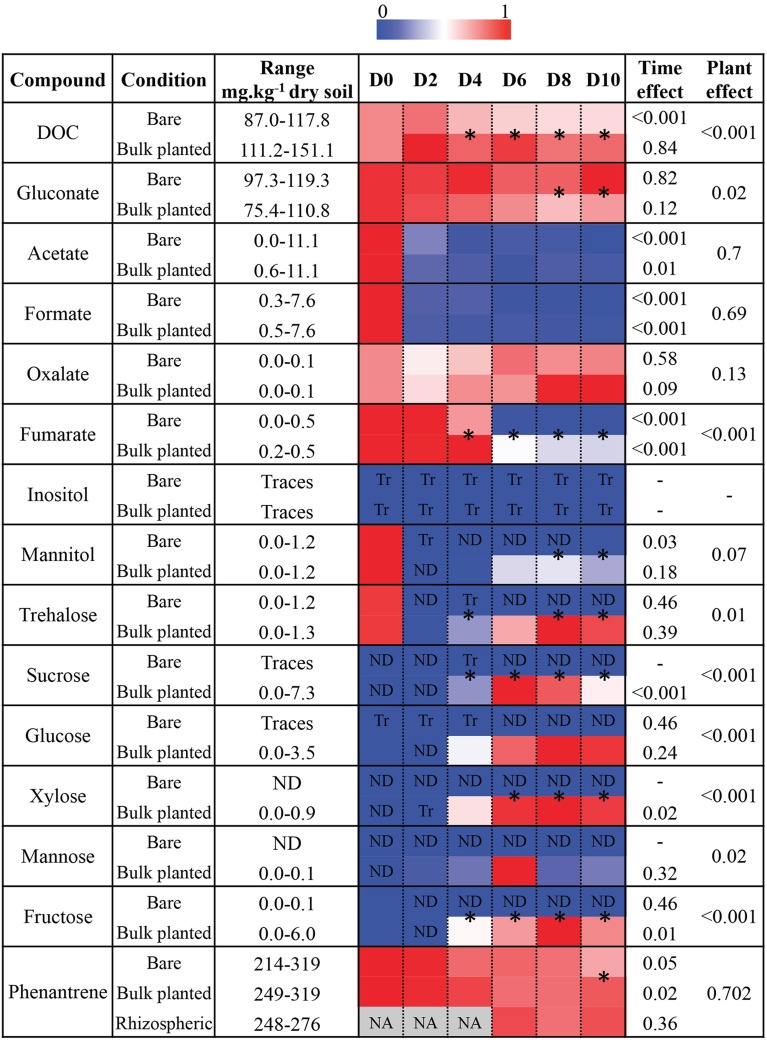
Figure 2.
Changes in total dissolved organic carbon (DOC), organic acids, sugars, and phenanthrene concentration in soil extracts over time, in bare and bulk planted soils from day 0 (D0) to day 10 (D10). For each compound, maximum detected concentrations were set to 1 and measurements were scaled accordingly. Values are means of three independent replicate microcosms. P-values obtained from one-way ANOVAs testing for the overall effect of vegetation and the effect of time for each condition are given. Asterisks between two adjacent cells denote significantly different values between bare and bulk planted soil (t-test, P < 0.05).

