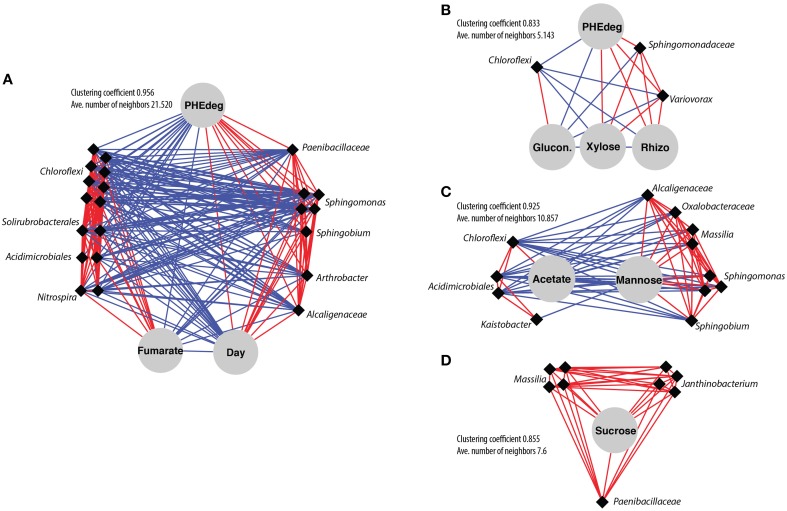
Figure 6.
Co-varying networks based on local similarity analysis of abundant OTUs in cDNA libraries (>1% in at least one sample) and environmental variables. (A) Sub-network from bare soil centered around phenanthrene degradation. (B–D) Sub-networks from bulk planted soil centered around phenanthrene degradation (B), mannose (C), and sucrose (D). Only associations with P < 0.01 were considered significant (Q < 0.005 and 0.012 for bare and bulk planted soil, respectively). Red and blue line edges represent positive and negative associations, respectively. OTUs are diamonds (with taxonomy) and environmental factors are circles.

