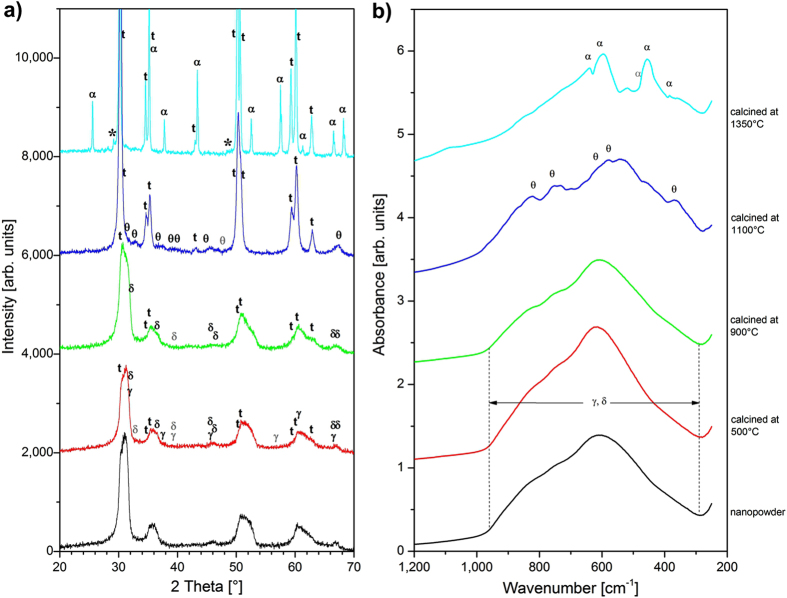
Figure 3. Evolution of the crystal phases in the CoLAVA nanopowder with increasing calcination temperatures.
(a) XRD analyses and (b) FTIR spectrometry of the nanopowder as prepared (—) as well as calcined at 500 °C ( ), 900 °C (
 ), 1100 °C (
 ), and 1350 °C (
 ), labelling “t” denotes tetragonal zirconia, “γ”, “δ”, “θ”, and “α” denote the alumina phases, and “*” marks yttria reflections.

