
Figure 3. Scatterplots showing individual indices as obtained from task 1 (selective neural entrainment at the beat frequency and neural entrainment to an endogenous beat), task 2 (synchronization accuracy) and task 3 (temporal prediction).
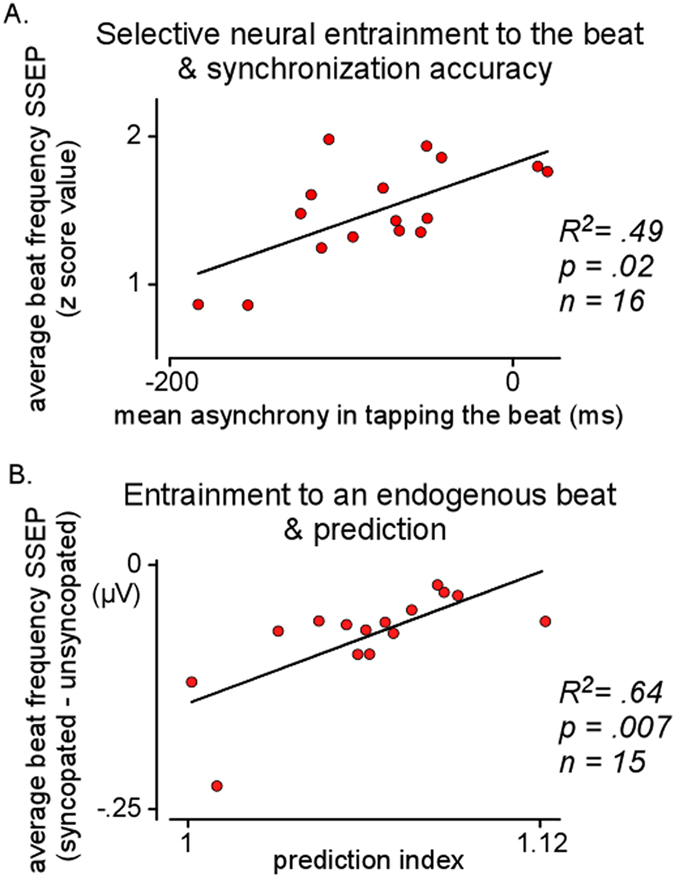
Panel A illustrates that synchronization accuracy improves (mean signed asynchronies closer to zero when synchronizing to the beat) with increasing strength of selective neural entrainment to the beat. Panel B illustrates that individuals with high prediction indices show high neural entrainment to an endogenous beat. Note that 3 from the 18 participants did not return for task 3 and that 2 from the 18 participants were excluded from task 2 analyses because they did not tap as instructed.