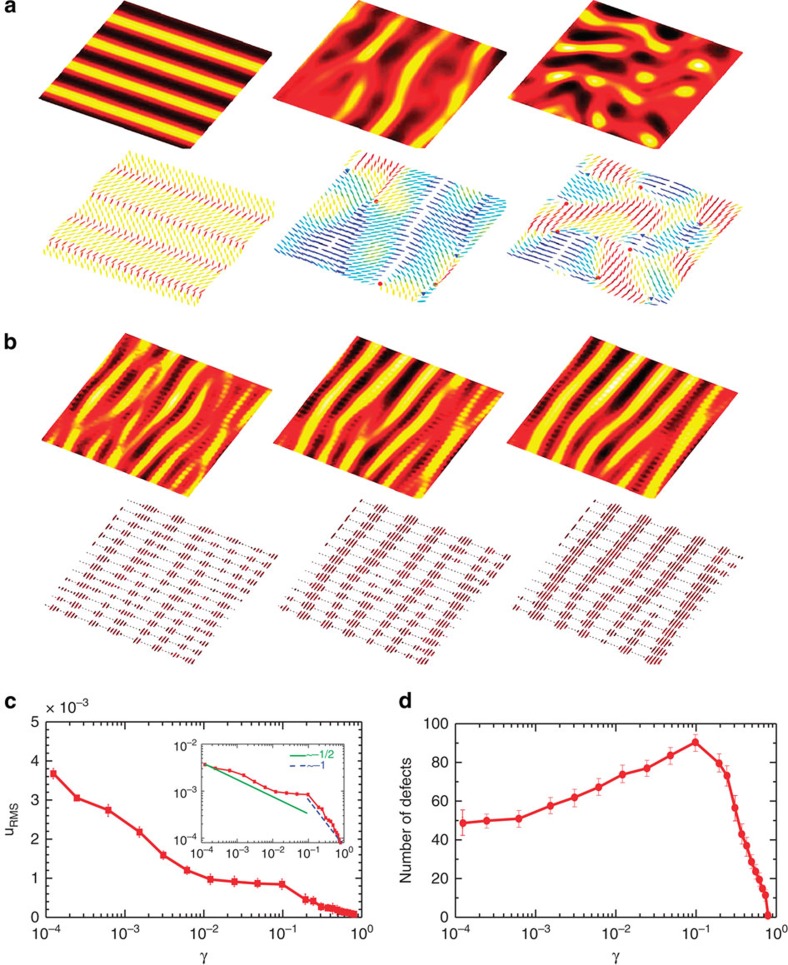
Figure 2. Increasing friction drives the crossover from wet to dry active nematics.
(a,b) Temporal evolution of the concentration field and nematic director field for (a) γ=0.08 and (b) γ=0.8 with t=105, 5 × 10⁵, 8 × 10⁵ (in LB units) for left, middle and right columns, respectively. For each value of the friction the top row is a colour map indicating variations in concentration and the bottom row is the corresponding director field coloured by the orientation of nematic directors. +1/2 and −1/2 defects are denoted by red circles and blue triangles. (c) The RMS velocity is reduced by increasing friction. The inset illustrates the variation in log–log plot, showing the existence of different exponents. (d) The total number of topological defects initially increases, but drops sharply at γ∼0.1 and disappears at the dry limit.

