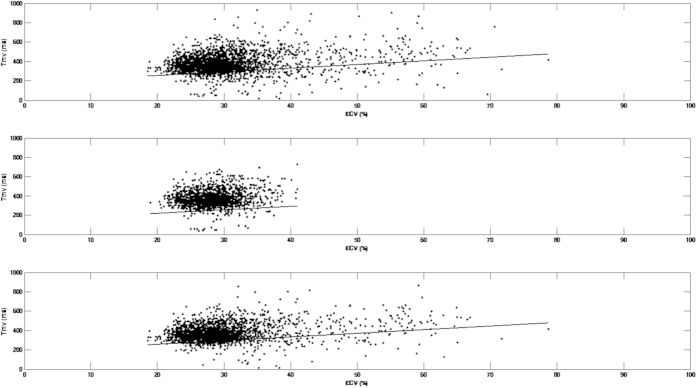
Figure 1. Scatterplot of extracellular volume fraction (ECV) and time taken to reach minimum regional volume (Tmv) of each segment in all patients (Fig. 1A), patients without late gadolinium enhancement (LGE) (Fig. 1B) and patients with QRS <120 ms (Fig. 1C).
The black line is a regression line indicates the fixed effect of ECV on Tmv.

