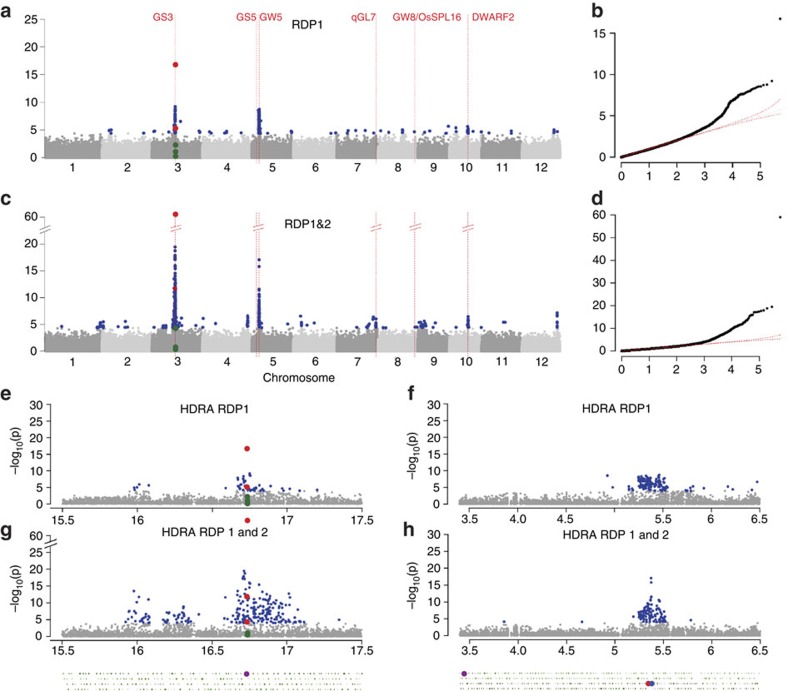
Figure 3. GWAS for rice grain length.
Manhattan plots (a,c) and quantile–quantile plots (b,d) for GWAS using the HDRA on RDP1 (a,b); and GWAS using the HDRA on RDP1 and 2 (b,d). On each Manhattan plot, the x-axis shows the SNPs along each chromosome; y-axis is the −log10 (P value) for the association. Red vertical lines indicate the position of candidate genes and/or QTL regions associated with grain length. (e,g) Zoom-in on the major GWAS peaks for grain length on chromosomes 3 (15.5–17.5 Mb) using (e) the HDRA on RDP1; and (g) the HDRA on RDP1 and 2. Zoom-in of the major GWAS peaks for grain length on chromosomes 5 using (f) the HDRA on RDP1; and (h) the HDRA on RDP1 and 2. Green circles underneath each set of plots represent gene models; the gene model highlighted in magenta in e,g is GS3 (LOC_Os03g0407400); gene models highlighted in f,h are GS5 (LOC_Os05g06660, magenta) and the two gene models flanking the GW5 deletion, LOC_Os05g09510 (blue) and LOC_Os05g09520 (red). In all panels, significant SNPs (with P values at or above the 10% FDR threshold) are coloured blue. In a,c,e,g, the SNPs that fall within the coding region of GS3 are highlighted in green if they have non-significant P values and in red if they have significant P values. The SNPs highlighted are (SNP name (P value for RDP1, P value for RDP1 and 2)): SNP-3.16728637 (0.69, 0.50); SNP-3.16730230 (1.00, 0.21); SNP-3.16732086 (1.83e−17, 1.05 e−59); SNP-3.16732418 (6.25 e−06, 1.96 e−12); SNP-3.16733169 (0.01, 7.02 e−05) and SNP-3.16733346 (0.12, 0.42).

