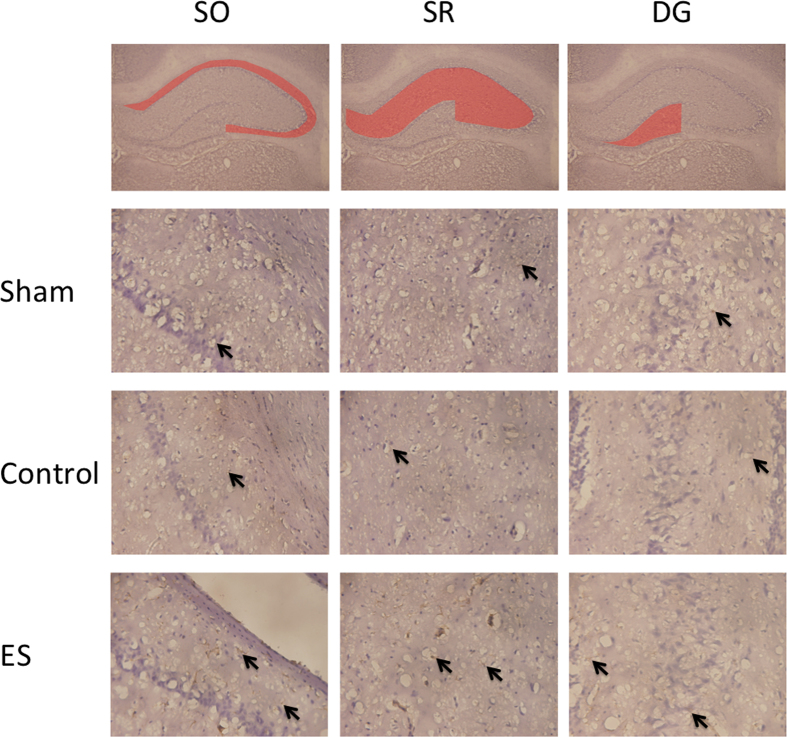
Figure 3. Effect of 2-Hz electric stimulation on number of GFAP positively stained cells (400×).
Sham: sham group; Control: control group; ES: electric stimulation group. In the SO, SR, and DG, the number of GFAP positively stained cells (arrow) in the ES was greater than those in the Sham and Control. SO: strata oriens; SR: strata radiatum; DG: dentate gyrus.

