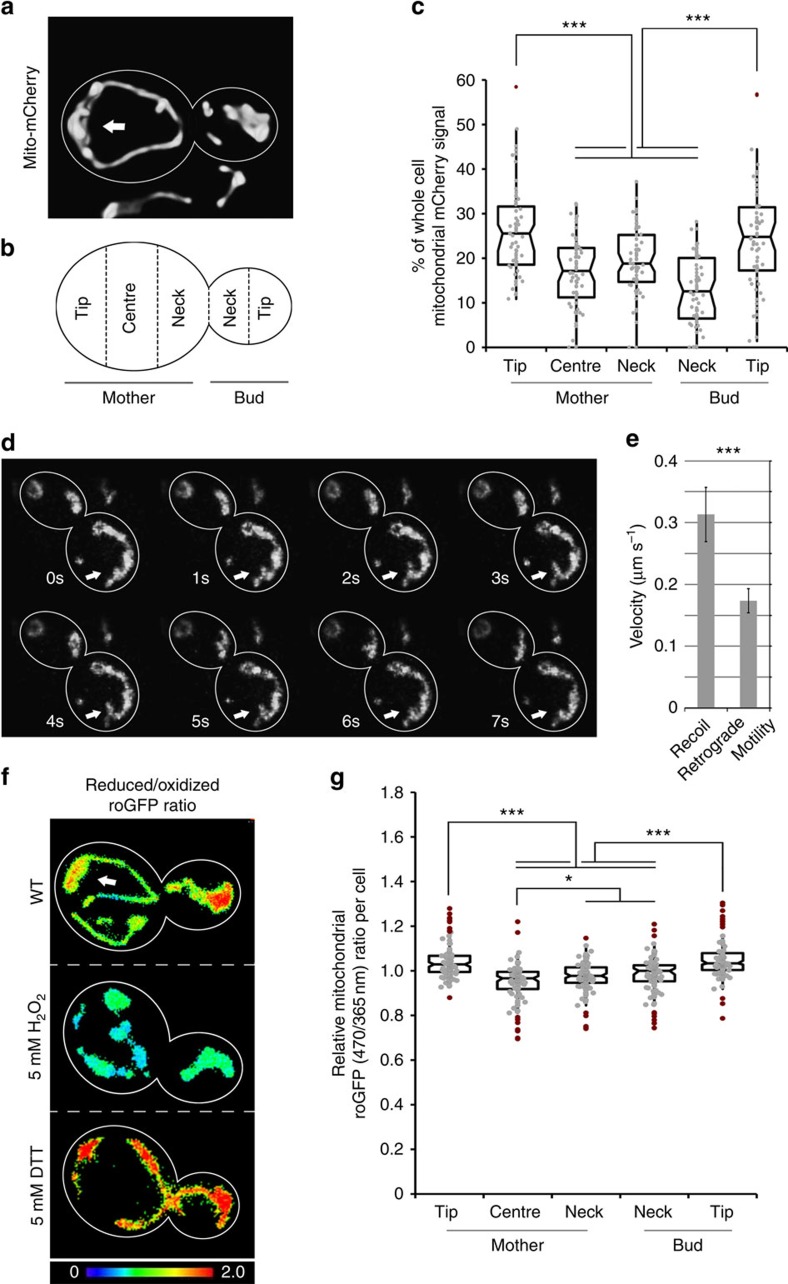
Figure 1. A population of higher-functioning mitochondria are anchored to and accumulate at the tip of the mother cell.
(a–c) Wild-type yeast cells that express the mitochondria-targeted fusion protein, Cit1p-mCherry, were grown to mid-log phase and visualized by fluorescence microscopy. (a) Representative volume rendering of mitochondria. Cell outlines are shown in white. Arrow points to mitochondria accumulated in the mother cell tip. (b) Schematic indicating regions of interest for quantification of mitochondrial distribution. (c) Notched box plot of mitochondrial distribution in cells. Mitochondrial distribution was determined by measuring the integrated fluorescence of Cit1p-mCherry in regions defined in b. The central band in the box represents the median, boxes indicate the middle quartiles and whiskers extend to the 5th and 95th percentiles; red dots indicate data points beyond this range. Data are representative of three independent experiments (n=40). (d) Frames from a time-lapse series showing a mitochondrion (arrows) that undergoes bud-directed movement from the mother cell tip and then rapidly recoils to the mother tip. (e) Velocity of mitochondria undergoing mitochondrial ‘springback' events, defined as described in Methods, and typical retrograde motility. Error bars represent s.e.m. (f) Wild-type (WT) cells expressing mito-roGFP1 were grown to mid-log phase and visualized by fluorescence microscopy. Images are reduced/oxidized mito-roGFP1 ratios. Colour scale indicates ratio values; higher numbers and warmer colours indicate more reducing mitochondria. (g) Quantification of the relative mitochondrial roGFP1 ratio as a function of position within WT yeast cells containing large buds (bud diameter>50% of mother diameter). Local ratios were normalized to the ratio for the cell as a whole. n>40 cells. Data are representative of three trials. Scale bars, 1 μm. Statistical significance was determined by Student's t-test. *P<0.05, **P<0.01 and ***P<0.005.

