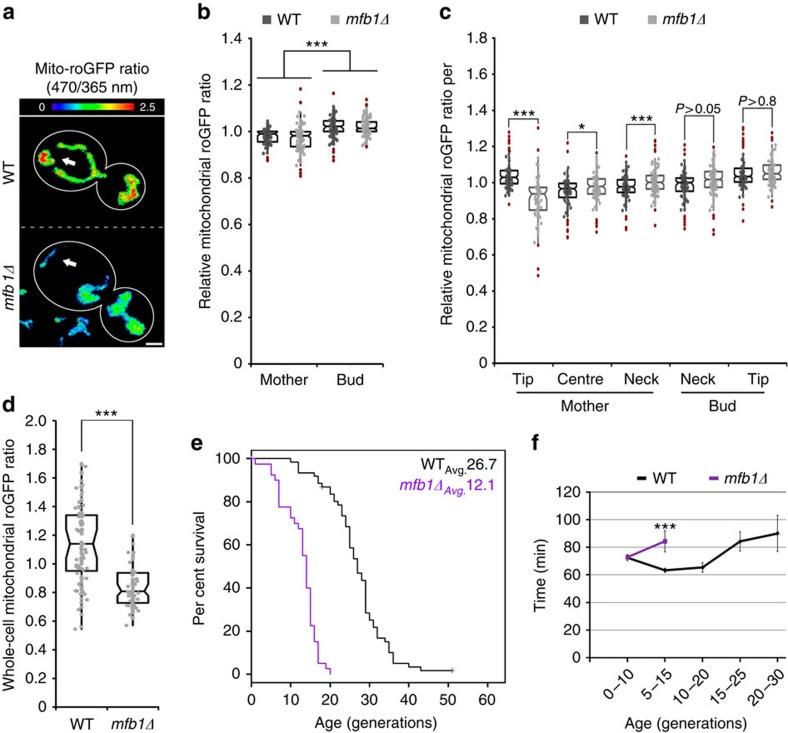
Figure 3. Mfb1p is required for enrichment of high-functioning mitochondria in the mother cell tip and normal mitochondrial function and RLS.
(a–d) Cells expressing mito-roGFP1 were grown to mid-log phase and visualized by fluorescence microscopy as described in Methods. (a) Representative images of reduced/oxidized mito-roGFP1 ratios in wild-type (WT) and mfb1Δ cells. Higher numbers and warmer colours indicate more reducing mitochondria. Arrows highlight mitochondria at the mother tip. Cell outlines are shown in white; scale bar, 1 μm. (b,c) Comparison of the reduced/oxidized mito-roGFP1 ratio, normalized to the whole-cell ratio, in WT and mfb1Δ cells, between (b) mother and bud, and (c) five zones of the cell as defined in Fig. 1b (n>40 cells per strain). (d) Comparison of absolute mito-roGFP1 ratio between WT and mfb1Δ cells (n>40 per strain). Central bands in the boxes represent the median, boxes indicate the middle quartiles and whiskers extend to the 5th and 95th percentiles; red dots indicate data points beyond this range. All data are representative of three independent experiments. (e) Kaplan–Meier survival plot of RLS of WT and mfb1Δ mother cells. Cells were grown to mid-log phase, arranged via micro-manipulation and RLS of newborn cells was determined from their first division as described in Methods (n>40 for each strain in 2 independent experiments). (f) Mean generation time was calculated as the number of minutes between cell divisions during the RLS experiments for WT and mfb1Δ cells of different replicative ages. Error bars represent s.e.m. For e, statistical significance was determined using the log-rank test: WT versus mfb1Δ, P<10−11. For other panels, statistical significance was determined using Student's t-test; *P<0.05, **P<0.01 and ***P<0.005.

